HOT TOPICS LIST
- MACD
- Fibonacci
- RSI
- Gann
- ADXR
- Stochastics
- Volume
- Triangles
- Futures
- Cycles
- Volatility
- ZIGZAG
- MESA
- Retracement
- Aroon
INDICATORS LIST
LIST OF TOPICS
PRINT THIS ARTICLE
by Gary Grosschadl
Vaxgen (VXGN) is looking bullish -- provided a breakout on good volume ensues.
Position: Hold
Gary Grosschadl
Independent Canadian equities trader and technical analyst based in Peterborough
Ontario, Canada.
PRINT THIS ARTICLE
TRIANGLES
Vaxgen Inc. Has Breakout Potential
04/19/04 09:20:09 AMby Gary Grosschadl
Vaxgen (VXGN) is looking bullish -- provided a breakout on good volume ensues.
Position: Hold
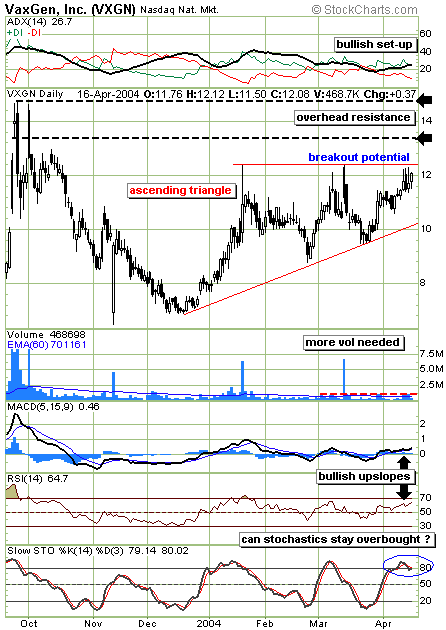
| This daily chart below shows one of my favorite patterns -- an ascending triangle. The ascending triangle is considered bullish and the pattern forms as an overhead resistance line is tested several times while the bottom support zone keeps tightening. Traders who spot this formation should watch for an upside break on, ideally, convincing volume. |
| Besides the bullish formation, several indicators are hinting at the possibility of an upside break. The first is that the last trading session resulted in the highest close since this triangle pattern started, occurring close to the breakout line. This can be an early heads-up signal for future developments. Several indicators are also showing a positive bias. The directional movement indicator at the top of the chart shows a bullish set-up with a rising ADX above 25. This value and upslope holds the promise of good and growing trend strength. Likewise the MACD (moving averge convergence/divergence) and the RSI (relative strength index) also show bullish strength above their respective 0 and 50 levels while enjoying their own healthy upslopes. The stochastics indicator has a more sobering view, reminding traders that we are in overbought territory susceptable to a downswing. However with growing trend strength, the possibility of stochastics "sticking high" exists. The stochastics indicator is best used in non-trending or weakly trending markets. In strongly trending markets, this indicator can stay in overbought territory for extended periods. |

|
| VXGN holds bullish promise. |
| Graphic provided by: Stockcharts.com. |
| |
| Should an upside break soon occur, watch the volume. Significant volume will be needed for a sustained drive north especially to overcome the resistance levels shown. A breakout past $12.40 has initial resistance at the top of a previous gap, around $13.30 and the larger upside target is $14.80. |
| In summary, short-term traders may find a trading opportunity if VXGN makes a bold move past $12.40, keeping a watchful eye on the overhead resistance lines as mentioned. Sometimes these patterns will make an initial break past resistance and then return to test the breakout point before launching on a bigger upside drive. Keep this in mind as another trading opportunity may evolve. |
Independent Canadian equities trader and technical analyst based in Peterborough
Ontario, Canada.
| Website: | www.whatsonsale.ca/financial.html |
| E-mail address: | gwg7@sympatico.ca |
Click here for more information about our publications!
PRINT THIS ARTICLE

Request Information From Our Sponsors
- VectorVest, Inc.
- Executive Premier Workshop
- One-Day Options Course
- OptionsPro
- Retirement Income Workshop
- Sure-Fire Trading Systems (VectorVest, Inc.)
- Trading as a Business Workshop
- VectorVest 7 EOD
- VectorVest 7 RealTime/IntraDay
- VectorVest AutoTester
- VectorVest Educational Services
- VectorVest OnLine
- VectorVest Options Analyzer
- VectorVest ProGraphics v6.0
- VectorVest ProTrader 7
- VectorVest RealTime Derby Tool
- VectorVest Simulator
- VectorVest Variator
- VectorVest Watchdog
- StockCharts.com, Inc.
- Candle Patterns
- Candlestick Charting Explained
- Intermarket Technical Analysis
- John Murphy on Chart Analysis
- John Murphy's Chart Pattern Recognition
- John Murphy's Market Message
- MurphyExplainsMarketAnalysis-Intermarket Analysis
- MurphyExplainsMarketAnalysis-Visual Analysis
- StockCharts.com
- Technical Analysis of the Financial Markets
- The Visual Investor
