HOT TOPICS LIST
- MACD
- Fibonacci
- RSI
- Gann
- ADXR
- Stochastics
- Volume
- Triangles
- Futures
- Cycles
- Volatility
- ZIGZAG
- MESA
- Retracement
- Aroon
INDICATORS LIST
LIST OF TOPICS
PRINT THIS ARTICLE
by Gary Grosschadl
After coming off a double bottom, USD nears a target zone.
Is it falling just short or reloading for another go?
Position: Hold
Gary Grosschadl
Independent Canadian equities trader and technical analyst based in Peterborough
Ontario, Canada.
PRINT THIS ARTICLE
CHART ANALYSIS
U.S. Dollar Index Contemplates Target Zone
04/20/04 10:50:46 AMby Gary Grosschadl
After coming off a double bottom, USD nears a target zone.
Is it falling just short or reloading for another go?
Position: Hold
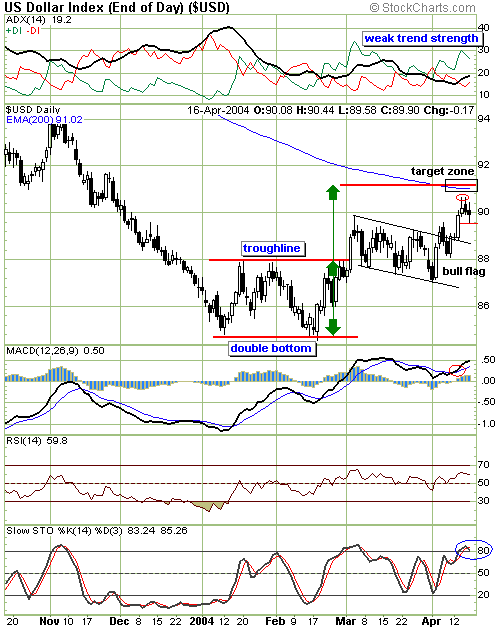
| The daily chart shows how this currency index made an important break past an overhead resistance line (troughline) back in early March. As is often the case, this was not the beginning of a big move in the immediate short-term. Instead, a sideways consolidation ensued which eventually took the form of a bull flag. Last week the bull flag, true to its nature, finally broke to the upside. |
| A target zone of 91 is clearly established by both the double bottom and the 200-day EMA. But where do we stand right now? The drive north has apparently stalled just short of the target -- or has it? This is usually the quandry of the short-term trader: What happens next? |

|
| The USD daily chart is caught between the target zone and a bull flag. |
| Graphic provided by: Stockcharts.com. |
| |
| As a short-term trader I am concerned with the following: The drive fell short of the target as the trend strength was not quite enough, as measured by the ADX (top chart) The ADX is part of the directional movement indicator. Generally speaking an ADX under 20 is not a confidence builder. Looking back at the initial break past the troughline, note that a multi-week sideways move ensued, as confirmed by a stochastic downturn from the 80 level. It is possible that a similar event will occur here? Perhaps, but (there is always an alternative in analysis) this is tempered by the MACD's (moving average convergence/divergence) movement. The MACD is still bullish (it normally lags the quicker stochastics) until it crosses back down over its signal line. In other words the "wisdom" of MACD is saying "Wait, don't jump to conclusions just yet." |
| For the trader considering candlesticks only, here is my analysis: The upswing was halted by a tweezer top (upper shadows circled in red) and the last trading session may have defined the short-term support, that being the bottom of that spinning top candle. The prudent plan here would be to simply wait for a break either way, which would be a move past the tweezer top or a close below the previous candlestick bottom of 89.60. |
| In summary, either the current move has topped out just shy of the target zone and will reload for another bullish thrust, or the move has topped out and will break nearby support and test the previous bull flag while undergoing a more substantial stochastic downturn towards the 20 level or lower. The prudent plan is to wait for the price to move one way or the other. |
Independent Canadian equities trader and technical analyst based in Peterborough
Ontario, Canada.
| Website: | www.whatsonsale.ca/financial.html |
| E-mail address: | gwg7@sympatico.ca |
Click here for more information about our publications!
Comments
Date: 04/21/04Rank: 3Comment:
Date: 05/04/04Rank: 3Comment:

Request Information From Our Sponsors
- VectorVest, Inc.
- Executive Premier Workshop
- One-Day Options Course
- OptionsPro
- Retirement Income Workshop
- Sure-Fire Trading Systems (VectorVest, Inc.)
- Trading as a Business Workshop
- VectorVest 7 EOD
- VectorVest 7 RealTime/IntraDay
- VectorVest AutoTester
- VectorVest Educational Services
- VectorVest OnLine
- VectorVest Options Analyzer
- VectorVest ProGraphics v6.0
- VectorVest ProTrader 7
- VectorVest RealTime Derby Tool
- VectorVest Simulator
- VectorVest Variator
- VectorVest Watchdog
- StockCharts.com, Inc.
- Candle Patterns
- Candlestick Charting Explained
- Intermarket Technical Analysis
- John Murphy on Chart Analysis
- John Murphy's Chart Pattern Recognition
- John Murphy's Market Message
- MurphyExplainsMarketAnalysis-Intermarket Analysis
- MurphyExplainsMarketAnalysis-Visual Analysis
- StockCharts.com
- Technical Analysis of the Financial Markets
- The Visual Investor
