HOT TOPICS LIST
- MACD
- Fibonacci
- RSI
- Gann
- ADXR
- Stochastics
- Volume
- Triangles
- Futures
- Cycles
- Volatility
- ZIGZAG
- MESA
- Retracement
- Aroon
INDICATORS LIST
LIST OF TOPICS
PRINT THIS ARTICLE
by Gary Grosschadl
Traders who anticipated the likelihood of a possible double top move towards the troughline test were rewarded.
Position: N/A
Gary Grosschadl
Independent Canadian equities trader and technical analyst based in Peterborough
Ontario, Canada.
PRINT THIS ARTICLE
CHART ANALYSIS
An Early Trend Failure For Gold Or A Bounce Setting Up?
04/16/04 09:37:42 AMby Gary Grosschadl
Traders who anticipated the likelihood of a possible double top move towards the troughline test were rewarded.
Position: N/A
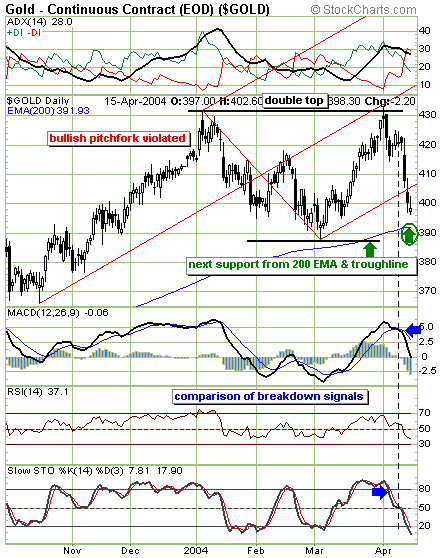
| The anticipated double top for Gold continuous contracts (EOD and $GOLD) formed in early April. As the Andrews pitchfork shows on the daily chart below, the double top kiss coincided with a move to the pitchfork's median line target, just above $430. Now the lowest pitchfork (median) line has been violated. This is often an early sign of trend failure. If the price of gold does not quickly pop back inside the pitchfork, then more downside is likely. The next downside support should come in the area circled, from $386 to $392. This represents the double top troughline and the ever-important 200-day EMA (exponential moving average). |
| Should a bounce ensue now or from lower support, watch that lower median line as this may be crucial. Failure there can be as telling as a successful move back inside the pitchfork. Should things turn very bearish and the troughline be eventually broken, the double top's target could be as low as $350. However a bold move back inside the pitchfork also holds the chance of a move to test $430 and higher should a repeat move to the median line target occur. |

|
| The daily chart shows both danger and opportunity. |
| Graphic provided by: Stockcharts.com. |
| |
| Several indicators are worth mentioning. The stochastics indicator is now in oversold territory, being under 20, so some kind of bounce attempt can be expected. Note the comparison of breakdown signals from the lower indicators. As is often the case, stochastics gave the earliest warning of a downside move as it fell below the 80 level. Next was the MACD's (moving average convergence/divergence) bearish cross followed by the RSI (relative strength index) breaking below its important 50 level). For the short-term technical trader, it is hard to beat the stochastics indicator for early signals. However, to guard against whipsaw signals it is prudent to wait for confirmation from other sources as you consider the weight of evidence. |
Independent Canadian equities trader and technical analyst based in Peterborough
Ontario, Canada.
| Website: | www.whatsonsale.ca/financial.html |
| E-mail address: | gwg7@sympatico.ca |
Click here for more information about our publications!
Comments
Date: 04/20/04Rank: 5Comment:

|

Request Information From Our Sponsors
- StockCharts.com, Inc.
- Candle Patterns
- Candlestick Charting Explained
- Intermarket Technical Analysis
- John Murphy on Chart Analysis
- John Murphy's Chart Pattern Recognition
- John Murphy's Market Message
- MurphyExplainsMarketAnalysis-Intermarket Analysis
- MurphyExplainsMarketAnalysis-Visual Analysis
- StockCharts.com
- Technical Analysis of the Financial Markets
- The Visual Investor
- VectorVest, Inc.
- Executive Premier Workshop
- One-Day Options Course
- OptionsPro
- Retirement Income Workshop
- Sure-Fire Trading Systems (VectorVest, Inc.)
- Trading as a Business Workshop
- VectorVest 7 EOD
- VectorVest 7 RealTime/IntraDay
- VectorVest AutoTester
- VectorVest Educational Services
- VectorVest OnLine
- VectorVest Options Analyzer
- VectorVest ProGraphics v6.0
- VectorVest ProTrader 7
- VectorVest RealTime Derby Tool
- VectorVest Simulator
- VectorVest Variator
- VectorVest Watchdog
