HOT TOPICS LIST
- MACD
- Fibonacci
- RSI
- Gann
- ADXR
- Stochastics
- Volume
- Triangles
- Futures
- Cycles
- Volatility
- ZIGZAG
- MESA
- Retracement
- Aroon
INDICATORS LIST
LIST OF TOPICS
PRINT THIS ARTICLE
by Gary Grosschadl
After a strong rise the Euro Index has corrected to meaningful support.
Position: Buy
Gary Grosschadl
Independent Canadian equities trader and technical analyst based in Peterborough
Ontario, Canada.
PRINT THIS ARTICLE
WEDGE FORMATIONS
Euro Index Primed For Likely Rise
04/19/04 10:53:39 AMby Gary Grosschadl
After a strong rise the Euro Index has corrected to meaningful support.
Position: Buy
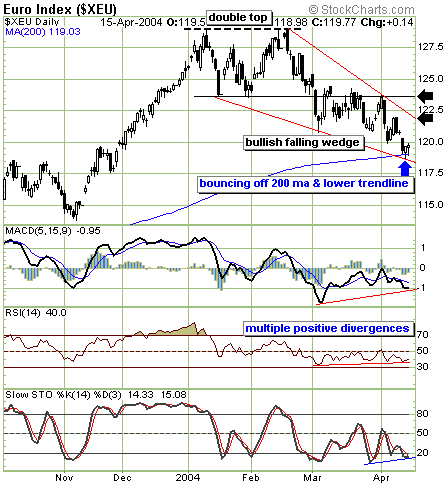
| The daily chart below shows how this currency's index hit a double top formation last February. After breaking below the troughline, several attempts were made until the pattern corrected further down to satisfy the double top target (the distance from troughline to top as applied to the downside break). |
| Now traders have several reasons to believe that an upswing may be in order. The index has corrected down to its 200-day moving average, which is often a turning point. This area also coincides with the lower trendline of a bullish falling wedge. Wedges pointing up tend to be bearish formations especially after a strong move up, while the reverse is also often true, which may be the case here. |

|
| The Euro Index may be due to reverse. |
| Graphic provided by: Stockcharts.com. |
| |
| Several indicators also hint at bullishness. These three indicators all show positive divergences to recent price action. When price action moves to further lows and several indicators do not follow in a similar fashion, a stronger positive divergence exists. The more divergences, the better the chance of a reversal. |
| The recent candlestick action also lends itself to possible bullish action ahead. Should an upleg develop, two overhead resistance areas to consider are shown by the arrows, the first being the wedge's upper trendline and the next being the original troughline just above 123.5. Strength above that troughline could eventually challenge the previous double top but that may take some time to develop. |
Independent Canadian equities trader and technical analyst based in Peterborough
Ontario, Canada.
| Website: | www.whatsonsale.ca/financial.html |
| E-mail address: | gwg7@sympatico.ca |
Click here for more information about our publications!
Comments
Date: 04/19/04Rank: 5Comment:
Date: 04/20/04Rank: 5Comment:

Request Information From Our Sponsors
- VectorVest, Inc.
- Executive Premier Workshop
- One-Day Options Course
- OptionsPro
- Retirement Income Workshop
- Sure-Fire Trading Systems (VectorVest, Inc.)
- Trading as a Business Workshop
- VectorVest 7 EOD
- VectorVest 7 RealTime/IntraDay
- VectorVest AutoTester
- VectorVest Educational Services
- VectorVest OnLine
- VectorVest Options Analyzer
- VectorVest ProGraphics v6.0
- VectorVest ProTrader 7
- VectorVest RealTime Derby Tool
- VectorVest Simulator
- VectorVest Variator
- VectorVest Watchdog
- StockCharts.com, Inc.
- Candle Patterns
- Candlestick Charting Explained
- Intermarket Technical Analysis
- John Murphy on Chart Analysis
- John Murphy's Chart Pattern Recognition
- John Murphy's Market Message
- MurphyExplainsMarketAnalysis-Intermarket Analysis
- MurphyExplainsMarketAnalysis-Visual Analysis
- StockCharts.com
- Technical Analysis of the Financial Markets
- The Visual Investor
