HOT TOPICS LIST
- MACD
- Fibonacci
- RSI
- Gann
- ADXR
- Stochastics
- Volume
- Triangles
- Futures
- Cycles
- Volatility
- ZIGZAG
- MESA
- Retracement
- Aroon
INDICATORS LIST
LIST OF TOPICS
PRINT THIS ARTICLE
by Kevin Hopson
Fuelcell Energy recently broke out of a large bullish triangle formation, indicating much higher prices down the road.
Position: Accumulate
Kevin Hopson
Kevin has been a technical analyst for roughly 10 years now. Previously, Kevin owned his own business and acted as a registered investment advisor, specializing in energy. He was also a freelance oil analyst for Orient Trading Co., a commodity futures trading firm in Japan. Kevin is currently a freelance writer.
PRINT THIS ARTICLE
TRIANGLES
Fuelcell Energy's Bullish Triangle Breakout
04/15/04 11:07:02 AMby Kevin Hopson
Fuelcell Energy recently broke out of a large bullish triangle formation, indicating much higher prices down the road.
Position: Accumulate
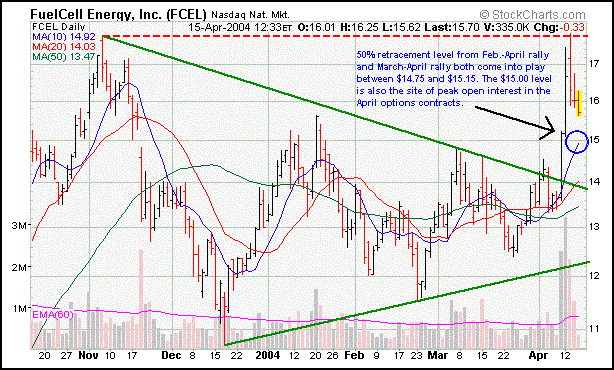
| Prior to last week, Fuelcell Energy (FCEL) had been in a bullish consolidation pattern for nearly five months. More specifically, the stock formed a large symmetrical triangle after moving up late last year. Since symmetrical triangles tend to be continuation patterns and the trend was up, a break to the upside was likely. As you can see in the six-month chart, an upside breakout occurred earlier this month, thus confirming the pattern. |
| Now that Fuelcell has broken out, I believe the stock could eventually hit the $21.00 level. I calculated this price target by taking the base of the triangle (high - low) and then adding this number ($17.80 - $10.80 = $7.00) to the breakout point ($14.00). When you do this, you come up with an approximate price target of $21.00 ($14.00 + $7.00). Since Fuelcell has been pulling back on light volume after the recent run-up, the risk/reward is coming back into favor. |

|
| Graphic provided by: Stockcharts.com. |
| |
| For example, the 50 percent retracement level from the February-April rally and the March-April rally both come into play between $14.75 and $15.15. As you can see in the chart, the stock's rising 10-day moving average is also converging here. As a result, buying on a potential pullback to this price range could prove beneficial. |
| Since April options expire this Friday (4/16) and there is peak open interest in the $15.00 contracts, the stock price could close at (or around) this level on Friday. This means that a buying opportunity in the specified support range ($14.75-$15.15) could present itself. There also appears to be solid support around the $14.00 level, which is the site of the stock's 20-day moving average and the top (breakout point) of the prior triangle formation. As a result, I would look to accumulate shares of Fuelcell Energy on further weakness, in anticipation of a longer-term move up to the $21.00 level. |
Kevin has been a technical analyst for roughly 10 years now. Previously, Kevin owned his own business and acted as a registered investment advisor, specializing in energy. He was also a freelance oil analyst for Orient Trading Co., a commodity futures trading firm in Japan. Kevin is currently a freelance writer.
| Glen Allen, VA | |
| E-mail address: | hopson_1@yahoo.com |
Click here for more information about our publications!
Comments
Date: 04/17/04Rank: 5Comment:
Date: 04/26/04Rank: 5Comment:

Request Information From Our Sponsors
- StockCharts.com, Inc.
- Candle Patterns
- Candlestick Charting Explained
- Intermarket Technical Analysis
- John Murphy on Chart Analysis
- John Murphy's Chart Pattern Recognition
- John Murphy's Market Message
- MurphyExplainsMarketAnalysis-Intermarket Analysis
- MurphyExplainsMarketAnalysis-Visual Analysis
- StockCharts.com
- Technical Analysis of the Financial Markets
- The Visual Investor
- VectorVest, Inc.
- Executive Premier Workshop
- One-Day Options Course
- OptionsPro
- Retirement Income Workshop
- Sure-Fire Trading Systems (VectorVest, Inc.)
- Trading as a Business Workshop
- VectorVest 7 EOD
- VectorVest 7 RealTime/IntraDay
- VectorVest AutoTester
- VectorVest Educational Services
- VectorVest OnLine
- VectorVest Options Analyzer
- VectorVest ProGraphics v6.0
- VectorVest ProTrader 7
- VectorVest RealTime Derby Tool
- VectorVest Simulator
- VectorVest Variator
- VectorVest Watchdog
