HOT TOPICS LIST
- MACD
- Fibonacci
- RSI
- Gann
- ADXR
- Stochastics
- Volume
- Triangles
- Futures
- Cycles
- Volatility
- ZIGZAG
- MESA
- Retracement
- Aroon
INDICATORS LIST
LIST OF TOPICS
PRINT THIS ARTICLE
by Sean Moore
Richard D. Wyckoff outlined the necessity for defining the market trend in his classic stock analysis method first published in the early 1930s. Seventy years later, this remains an important concept for traders in a variety of financial markets.
Position: N/A
Sean Moore
Traders.com Staff Writer.
PRINT THIS ARTICLE
TRENDLINES AND CHANNELS
Wyckoff Part 1: Defining A Trend
05/09/00 12:03:06 AMby Sean Moore
Richard D. Wyckoff outlined the necessity for defining the market trend in his classic stock analysis method first published in the early 1930s. Seventy years later, this remains an important concept for traders in a variety of financial markets.
Position: N/A
| The Wyckoff method, developed by Richard D. Wyckoff in the early 1930s, has aided traders in their pursuit for successful trading since its inception. The goals of the method are simple: Select securities that will move soonest, fastest and farthest. Limit losses and let profits run. Make the most efficient use of investment capital. The philosophy of Wyckoff's teachings rests squarely on the law of supply and demand - when demand exceeds supply, prices rise; and when supply outpaces demand, prices decline. This universal theory can be applied to a variety of financial markets - stocks, bonds, options, or commodities. |
| The first basic building block for the Wyckoff method is the determination of the present position, and the probable future trend of the market. Then the trader decides whether the market is in a long (buy or cover), short (sell or sell short), or neutral position. To obtain an overall view of the market trend, look at a composite index chart, such as the Dow Jones Industrial Average, the S&P 500 Index, or the Nasdaq Composite Index. |

|
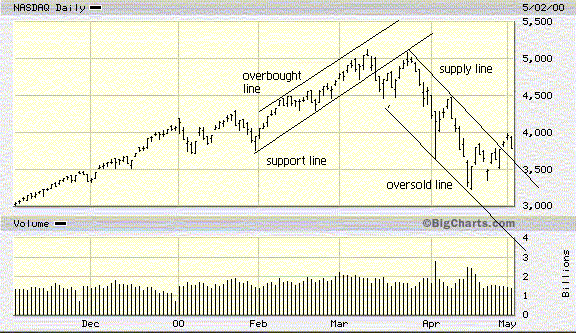
| Figure 1: Supply (resistance) and demand (support) lines for the Nasdaq Composite Index. |
| Graphic provided by: bigcharts.com. |
| |
| Uptrends can be charted using a demand line and an overbought line. A demand line shows an advancing angle in a bull market by passing through two successive points of support (the lowest points of two successive reactions). An overbought line is drawn parallel to the support line and passes through the first point of resistance (top of rally) that occurs between the support line's successive points of support (Figure 1). Downtrends are defined with a supply line and an oversold line. A supply line shows the angle of decline in a bear market by passing through two successive points of resistance (tops of rallies). An oversold line is drawn parallel to the supply line and passes through the first point of support (lowest point of a reaction) that occurs between the supply line's two successive tops (Figure 1). If the market is in a neutral position, the trading range is determined with a support level and a resistance level. |
| For a trending market, the demand and oversold lines provide support, while the supply and overbought lines provide resistance. Demand and oversold lines alert a trader to buy or cover, while supply and overbought lines indicate it's time to sell. These types of supply and demand lines can help the trader identify the trend and enter and exit trading positions with a little more certainty. For the Wyckoff method, this trend identification is the first step in determining what your trading position will be. |
Traders.com Staff Writer.
| Title: | Project Engineer |
| Company: | Technical Analysis, Inc. |
| Address: | 4757 California Ave. SW |
| Seattle, WA 98116 | |
| Phone # for sales: | 206 938 0570 |
| Fax: | 206 938 1307 |
| Website: | Traders.com |
| E-mail address: | smoore@traders.com |
Traders' Resource Links | |
| Charting the Stock Market: The Wyckoff Method -- Books | |
| Working-Money.com -- Online Trading Services | |
| Traders.com Advantage -- Online Trading Services | |
| Technical Analysis of Stocks & Commodities -- Publications and Newsletters | |
| Working Money, at Working-Money.com -- Publications and Newsletters | |
| Traders.com Advantage -- Publications and Newsletters | |
| Professional Traders Starter Kit -- Software | |
Click here for more information about our publications!
Comments
Date: / /Rank: 4Comment:

|

Request Information From Our Sponsors
- StockCharts.com, Inc.
- Candle Patterns
- Candlestick Charting Explained
- Intermarket Technical Analysis
- John Murphy on Chart Analysis
- John Murphy's Chart Pattern Recognition
- John Murphy's Market Message
- MurphyExplainsMarketAnalysis-Intermarket Analysis
- MurphyExplainsMarketAnalysis-Visual Analysis
- StockCharts.com
- Technical Analysis of the Financial Markets
- The Visual Investor
- VectorVest, Inc.
- Executive Premier Workshop
- One-Day Options Course
- OptionsPro
- Retirement Income Workshop
- Sure-Fire Trading Systems (VectorVest, Inc.)
- Trading as a Business Workshop
- VectorVest 7 EOD
- VectorVest 7 RealTime/IntraDay
- VectorVest AutoTester
- VectorVest Educational Services
- VectorVest OnLine
- VectorVest Options Analyzer
- VectorVest ProGraphics v6.0
- VectorVest ProTrader 7
- VectorVest RealTime Derby Tool
- VectorVest Simulator
- VectorVest Variator
- VectorVest Watchdog
