HOT TOPICS LIST
- MACD
- Fibonacci
- RSI
- Gann
- ADXR
- Stochastics
- Volume
- Triangles
- Futures
- Cycles
- Volatility
- ZIGZAG
- MESA
- Retracement
- Aroon
INDICATORS LIST
LIST OF TOPICS
PRINT THIS ARTICLE
by Koos van der Merwe
In today's market, with the liberation and occupation of Iraq affecting the market adversely, it is not easy finding a company that looks interesting as far as good profits are concerned. Here is one possibility that has shown up quite clearly on my radar screen and looks very promising. It is worth the risk? You decide.
Position: N/A
Koos van der Merwe
Has been a technical analyst since 1969, and has worked as a futures and options trader with First Financial Futures in Johannesburg, South Africa.
PRINT THIS ARTICLE
SYMMETRICAL TRIANGLE
eMAGIN Corporation.... Not That Imaginary
04/15/04 09:35:37 AMby Koos van der Merwe
In today's market, with the liberation and occupation of Iraq affecting the market adversely, it is not easy finding a company that looks interesting as far as good profits are concerned. Here is one possibility that has shown up quite clearly on my radar screen and looks very promising. It is worth the risk? You decide.
Position: N/A
| eMagin Corporation designs, develops, and markets virtual imaging system-on-a-chip solutions to enable the visual display of information, data, video, and games through a wide variety of mobile electronic devices and next-generation interactive virtual reality systems. The company looks interesting for the following reasons. |

|
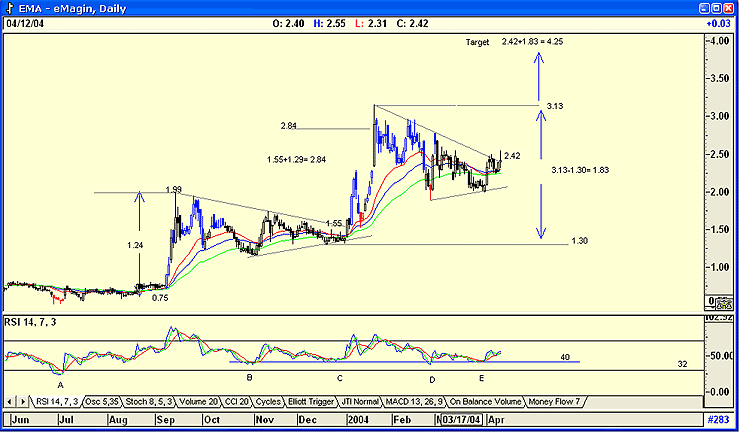
| Figure 1: eMagin's candlestick chart. |
| Graphic provided by: AdvancedGET. |
| Graphic provided by: Metastock. |
| |
| Looking at the chart you immediately see two consolidation triangles. The first one suggested a target of $2.84, which has already been exceeded. The second triangle suggests a target of $4.25. With the price of the stock at $2.42 as of the April 12th close, this is a good stock to purchase. I have shown in detail on the chart how I arrived at my target figures. But is now the correct time to buy shares? A look at the RSI indicator shows that although at point "A" on the indicator chart, the indicator gave a solid buy, when it broke the 32 level, at points "B'", "C", "D" and "E" the indicator flirted with the 40 level as a buy level. This could therefore suggest that eMagin is worth buying at the current price. |
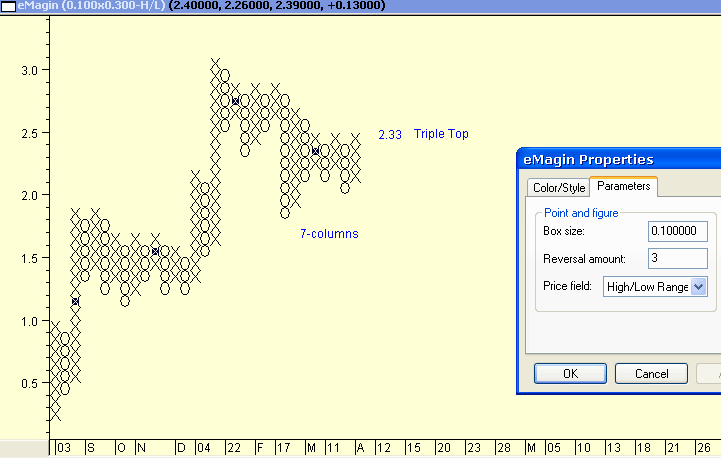
 Figure 2: Point and figure chart of eMAGIN. Looking at the point and figure chart however, you see that a very definite triple top has formed. The parameters I used are: Box size 0.1 on a 3 point reversal of the high low range. This suggests strong resistance, but, should the price rise above $2.33, we could see a target of $4.43, close enough to the target of $4.25 as calculated above. |
| The point and figure target was determined using the horizontal strategy as follows. There are seven columns in the width. The first down column leading to the consolidation is not counted. I then multiply the number of columns by the reversal points, in this case: 7 x 3 = 21. This is then multiplied by the box size: 21 x 0.1 = 2.1, added to the price at the triple top formation of $2.33 (2.33 + 2.10), which gives $4.43 . A break then above $2.33 will be a major buy signal and the stock can be bought with confidence. |
Has been a technical analyst since 1969, and has worked as a futures and options trader with First Financial Futures in Johannesburg, South Africa.
| Address: | 3256 West 24th Ave |
| Vancouver, BC | |
| Phone # for sales: | 6042634214 |
| E-mail address: | petroosp@gmail.com |
Click here for more information about our publications!
Comments
Date: 04/15/04Rank: 5Comment:

Request Information From Our Sponsors
- StockCharts.com, Inc.
- Candle Patterns
- Candlestick Charting Explained
- Intermarket Technical Analysis
- John Murphy on Chart Analysis
- John Murphy's Chart Pattern Recognition
- John Murphy's Market Message
- MurphyExplainsMarketAnalysis-Intermarket Analysis
- MurphyExplainsMarketAnalysis-Visual Analysis
- StockCharts.com
- Technical Analysis of the Financial Markets
- The Visual Investor
- VectorVest, Inc.
- Executive Premier Workshop
- One-Day Options Course
- OptionsPro
- Retirement Income Workshop
- Sure-Fire Trading Systems (VectorVest, Inc.)
- Trading as a Business Workshop
- VectorVest 7 EOD
- VectorVest 7 RealTime/IntraDay
- VectorVest AutoTester
- VectorVest Educational Services
- VectorVest OnLine
- VectorVest Options Analyzer
- VectorVest ProGraphics v6.0
- VectorVest ProTrader 7
- VectorVest RealTime Derby Tool
- VectorVest Simulator
- VectorVest Variator
- VectorVest Watchdog
