HOT TOPICS LIST
- MACD
- Fibonacci
- RSI
- Gann
- ADXR
- Stochastics
- Volume
- Triangles
- Futures
- Cycles
- Volatility
- ZIGZAG
- MESA
- Retracement
- Aroon
INDICATORS LIST
LIST OF TOPICS
PRINT THIS ARTICLE
by Ashwani Gujral
Even in choppy markets certain stocks show strong uptrends. These are the stocks that create wealth for investors and traders. But care should be taken to buy them on declines.
Position: N/A
Ashwani Gujral
He is founder of AGIP Securities Pvt. Ltd. which offers money management services, live chat rooms (during market hours) and independent technical analysis consultancy. The company has a big media presence from the likes of CNBC, NDTV Profit, and ZEE Business.
PRINT THIS ARTICLE
CHART ANALYSIS
Yahoo! Maintains Uptrend On Their Weekly Chart
04/13/04 11:44:31 AMby Ashwani Gujral
Even in choppy markets certain stocks show strong uptrends. These are the stocks that create wealth for investors and traders. But care should be taken to buy them on declines.
Position: N/A
| Choppy markets are known for sharp, two-way movements. Most often such markets occur because there are an equal number of bulls and bears. These are difficult markets to trade. These are not secular bull or bear markets, where going long or short will make money. Even in these widely swinging markets, certain stocks will be in strong weekly uptrends. Overall these stocks move up more than others, but they also go through sharp corrections. Traders should identify such stocks and buy them on these corrections. One such stock is Yahoo!, which I wrote about last December ("Yahoo! Consolidates Before Moving On," Traders.com Advantage, 12/29/2003). |

|
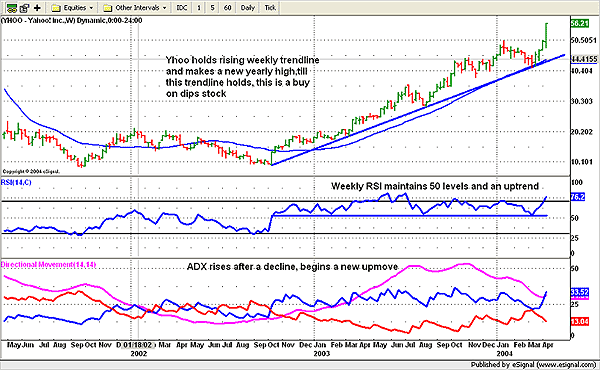
| Figure 1: Weekly chart of Yahoo! |
| Graphic provided by: eSignal. |
| |
| Looking at the weekly chart, Yahoo! has clearly held an upward sloping trendline since October 2003. Also visible is that Yahoo! has bounced off this trendline three times. This further strengthens the trendline and I can conclude that, until this trendline breaks, the uptrend will remain intact. Meanwhile, the weekly RSI continues to find support at the 50 level and trades in the bullish zone. The weekly ADX has started rising after a long decline, and thus indicates a trending move as well. An excellent time to enter Yahoo for the long-term is to buy when it hits the trendline again. |
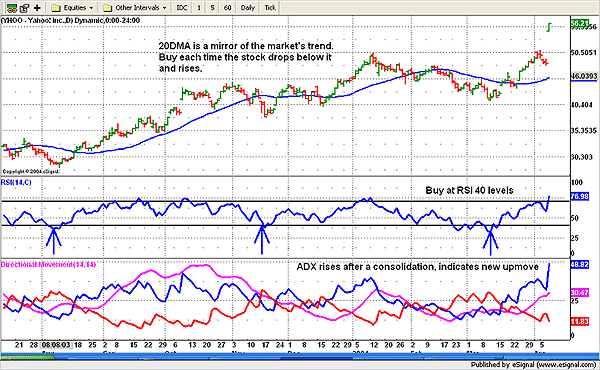
 Figure 2: Daily chart of Yahoo! On the daily chart, there is a milder uptrend. But Yahoo! has made a 2-year high, and 2-year highs should be respected. Now the key is to buy when Yahoo! is oversold. One method to do this is to adjust the oversold level of RSI to 40 and buy whenever RSI goes below 40. I chose the 40 level by looking at Yahoo's! past history. Whenever Yahoo! fell below 40, it went into a sustained rally. Also the ADX, after a long decline, has started rising. This is a sign of stronger trends ahead. |
| If there is one thing traders want to learn, it is how to get into trends, and this is the best swing trading strategy available. |
He is founder of AGIP Securities Pvt. Ltd. which offers money management services, live chat rooms (during market hours) and independent technical analysis consultancy. The company has a big media presence from the likes of CNBC, NDTV Profit, and ZEE Business.
| Title: | Chief mkt strategist |
| Company: | AGIP Securities |
| India | |
| Phone # for sales: | 9871066337 |
| Website: | www.ashwanigujral.com |
| E-mail address: | contact@ashwanigujral.com |
Traders' Resource Links | |
| AGIP Securities has not added any product or service information to TRADERS' RESOURCE. | |
Click here for more information about our publications!
Comments
Date: 04/14/04Rank: 4Comment:

Request Information From Our Sponsors
- StockCharts.com, Inc.
- Candle Patterns
- Candlestick Charting Explained
- Intermarket Technical Analysis
- John Murphy on Chart Analysis
- John Murphy's Chart Pattern Recognition
- John Murphy's Market Message
- MurphyExplainsMarketAnalysis-Intermarket Analysis
- MurphyExplainsMarketAnalysis-Visual Analysis
- StockCharts.com
- Technical Analysis of the Financial Markets
- The Visual Investor
- VectorVest, Inc.
- Executive Premier Workshop
- One-Day Options Course
- OptionsPro
- Retirement Income Workshop
- Sure-Fire Trading Systems (VectorVest, Inc.)
- Trading as a Business Workshop
- VectorVest 7 EOD
- VectorVest 7 RealTime/IntraDay
- VectorVest AutoTester
- VectorVest Educational Services
- VectorVest OnLine
- VectorVest Options Analyzer
- VectorVest ProGraphics v6.0
- VectorVest ProTrader 7
- VectorVest RealTime Derby Tool
- VectorVest Simulator
- VectorVest Variator
- VectorVest Watchdog
