HOT TOPICS LIST
- MACD
- Fibonacci
- RSI
- Gann
- ADXR
- Stochastics
- Volume
- Triangles
- Futures
- Cycles
- Volatility
- ZIGZAG
- MESA
- Retracement
- Aroon
INDICATORS LIST
LIST OF TOPICS
PRINT THIS ARTICLE
by Ashwani Gujral
In bull runs traders and investors often forget about corrections and consolidations. A high ADX should caution traders not to buy at higher levels as a consolidation can happen at any time. Soybean futures seems to be heading into one such consolidation.
Position: N/A
Ashwani Gujral
He is founder of AGIP Securities Pvt. Ltd. which offers money management services, live chat rooms (during market hours) and independent technical analysis consultancy. The company has a big media presence from the likes of CNBC, NDTV Profit, and ZEE Business.
PRINT THIS ARTICLE
CONSOLID FORMATION
Soybean Futures Ready For Long Consolidation?
04/13/04 11:40:59 AMby Ashwani Gujral
In bull runs traders and investors often forget about corrections and consolidations. A high ADX should caution traders not to buy at higher levels as a consolidation can happen at any time. Soybean futures seems to be heading into one such consolidation.
Position: N/A
| All traders know that bull runs are sharp uptrends. But they also need to remember that consolidations are part of bull runs, and a bull run that has taken a stock or commodity several times its starting value can run into a consolidation where it can lose 25% to 38.2% of the total rise. In such cases traders need to wait for the market to form a range. Once the upper and the lower boundaries are well-defined, this range is often large enough to trade on its own. Traders should not go long into a relatively large consolidation because the pattern can often be equal in length to the preceding bull run and can sometimes take all the profits and more from late entrants. So when does a correction occur in a bull market? There is no specific timing for this. But long traders should tighten stops and avoid fresh longs when the ADX is higher than 45. This often means that the trend might be overextended and it's time to play the range. |

|
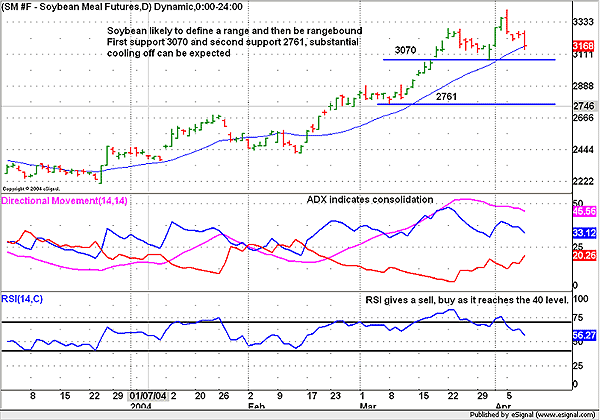
| Figure 1: Daily chart of Soybeans. |
| Graphic provided by: eSignal. |
| |
| On the daily chart, soybean futures have fallen below their previous top -- the first sign of an approaching consolidation. At the same time, the daily RSI is showing a negative divergence to price. This occurs when the price makes a higher high and the RSI makes a lower high. The RSI is leading the price to the downside as it breaks its own previous bottoms, indicating the price might do so also. Finally, the daily ADX is now declining after reaching a high value. The lower band of the sideway pattern could be much lower than traders might expect. Traders should buy once the RSI goes below 40 and then turns back and crosses above it. |
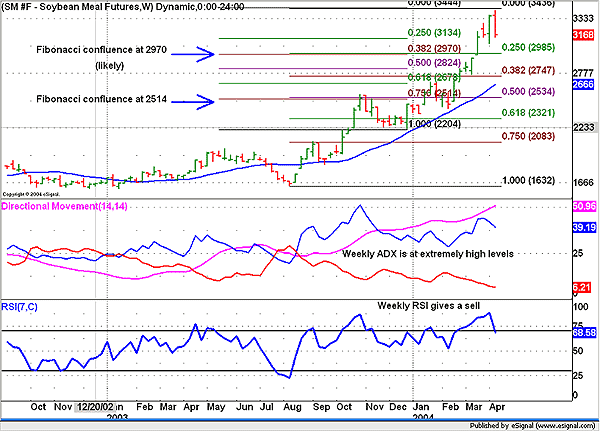
 Figure 2: Weekly chart of Soybean Futures. On the weekly chart, this sideways consolidation will probably look more like a flag pattern. Here, the two Fibonacci retracement tools are drawn from two significant swing lows to the high, and a confluence of levels is found. The levels of 2970 and 2514 seem to show a confluence of Fibonacci levels and are likely points for the lower boundary of the consolidation. Meanwhile, the weekly ADX continues to rise, indicating a strong weekly trend. The weekly RSI has given a sell signal which is a signal to get out of longs more than a signal for a trend reversal. |
| Soybeans are going to move sideways for a while and only in retrospect will it be known whether this was a topping out pattern or a consolidation. Meanwhile, traders need to figure out the range that is developing and try to trade it with reduced volumes. |
He is founder of AGIP Securities Pvt. Ltd. which offers money management services, live chat rooms (during market hours) and independent technical analysis consultancy. The company has a big media presence from the likes of CNBC, NDTV Profit, and ZEE Business.
| Title: | Chief mkt strategist |
| Company: | AGIP Securities |
| India | |
| Phone # for sales: | 9871066337 |
| Website: | www.ashwanigujral.com |
| E-mail address: | contact@ashwanigujral.com |
Traders' Resource Links | |
| AGIP Securities has not added any product or service information to TRADERS' RESOURCE. | |
Click here for more information about our publications!
Comments
Date: 04/21/04Rank: 3Comment:

Request Information From Our Sponsors
- StockCharts.com, Inc.
- Candle Patterns
- Candlestick Charting Explained
- Intermarket Technical Analysis
- John Murphy on Chart Analysis
- John Murphy's Chart Pattern Recognition
- John Murphy's Market Message
- MurphyExplainsMarketAnalysis-Intermarket Analysis
- MurphyExplainsMarketAnalysis-Visual Analysis
- StockCharts.com
- Technical Analysis of the Financial Markets
- The Visual Investor
- VectorVest, Inc.
- Executive Premier Workshop
- One-Day Options Course
- OptionsPro
- Retirement Income Workshop
- Sure-Fire Trading Systems (VectorVest, Inc.)
- Trading as a Business Workshop
- VectorVest 7 EOD
- VectorVest 7 RealTime/IntraDay
- VectorVest AutoTester
- VectorVest Educational Services
- VectorVest OnLine
- VectorVest Options Analyzer
- VectorVest ProGraphics v6.0
- VectorVest ProTrader 7
- VectorVest RealTime Derby Tool
- VectorVest Simulator
- VectorVest Variator
- VectorVest Watchdog
