HOT TOPICS LIST
- MACD
- Fibonacci
- RSI
- Gann
- ADXR
- Stochastics
- Volume
- Triangles
- Futures
- Cycles
- Volatility
- ZIGZAG
- MESA
- Retracement
- Aroon
INDICATORS LIST
LIST OF TOPICS
PRINT THIS ARTICLE
by Ashwani Gujral
Infospace has completed a head and shoulder bottom formed over the last two years and broken out to the upside. The target could be $50, with further upside possible.
Position: N/A
Ashwani Gujral
He is founder of AGIP Securities Pvt. Ltd. which offers money management services, live chat rooms (during market hours) and independent technical analysis consultancy. The company has a big media presence from the likes of CNBC, NDTV Profit, and ZEE Business.
PRINT THIS ARTICLE
HEAD & SHOULDERS
Infospace Gains Momentum
04/15/04 09:37:30 AMby Ashwani Gujral
Infospace has completed a head and shoulder bottom formed over the last two years and broken out to the upside. The target could be $50, with further upside possible.
Position: N/A
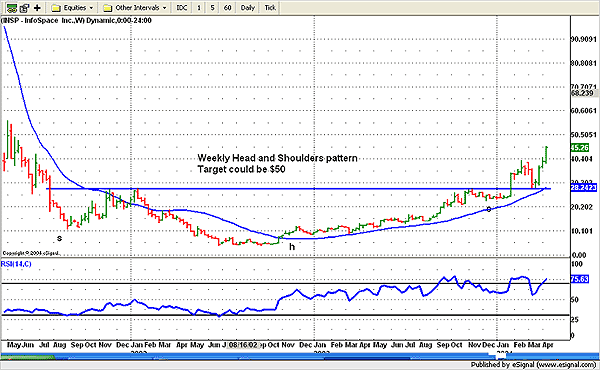
| It is not every day that you see a stock make a 2-year head and shoulders pattern and rise from $3 to about $45. When you see a stock in this pattern, you know the company has turned around. A head and shoulders pattern formed on a weekly basis signifies that the speculative froth is out of the stock and long-term players have accumulated on every decline. This is often because the company is back on track or was unfairly butchered at the end of the previous bear market. This kind of a long bottoming out process often forms a base from which sharper rallies can occur. Once the stock breaks out, you should buy on all corrections. |

|
| Figure 1: Weekly chart of Infospace |
| Graphic provided by: eSignal. |
| |
| On the weekly chart, a head and shoulders pattern has developed with the head dipping down to $3 at its lowest. The neckline of this pattern is at $28, and the target about $53. This target is calculated by measuring the depth of the head from the neckline and adding it to the top of the neckline. This could be an intermediate target as this stock seems to have bottomed out for the long-term. The RSI is maintaining a bullish level -- a sign that the stock is consistently achieving higher levels. |
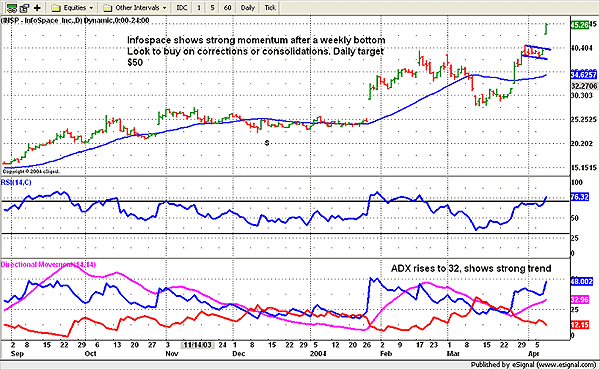
 Figure 2: Daily chart of Infospace. On the daily chart Infospace is showing a milder uptrend, which may get more ferocious since the stock has broken out of a head and shoulders pattern on the weekly chart. Traders should buy each time the stock drops below its 20-day MA, turns up, and trades above it. This is a mechanical way of buying on reaction. When a stock retreats from higher levels, the weak hands drop out and strong hands enter -- thus increasing the possibility of further gains. The daily ADX also turned up after showing consolidation for a long time, indicating a potential uptrend. As the market continues its 2-way wild swings, I would caution against momentum trading in any stock. |
He is founder of AGIP Securities Pvt. Ltd. which offers money management services, live chat rooms (during market hours) and independent technical analysis consultancy. The company has a big media presence from the likes of CNBC, NDTV Profit, and ZEE Business.
| Title: | Chief mkt strategist |
| Company: | AGIP Securities |
| India | |
| Phone # for sales: | 9871066337 |
| Website: | www.ashwanigujral.com |
| E-mail address: | contact@ashwanigujral.com |
Traders' Resource Links | |
| AGIP Securities has not added any product or service information to TRADERS' RESOURCE. | |
Click here for more information about our publications!
PRINT THIS ARTICLE

Request Information From Our Sponsors
- StockCharts.com, Inc.
- Candle Patterns
- Candlestick Charting Explained
- Intermarket Technical Analysis
- John Murphy on Chart Analysis
- John Murphy's Chart Pattern Recognition
- John Murphy's Market Message
- MurphyExplainsMarketAnalysis-Intermarket Analysis
- MurphyExplainsMarketAnalysis-Visual Analysis
- StockCharts.com
- Technical Analysis of the Financial Markets
- The Visual Investor
- VectorVest, Inc.
- Executive Premier Workshop
- One-Day Options Course
- OptionsPro
- Retirement Income Workshop
- Sure-Fire Trading Systems (VectorVest, Inc.)
- Trading as a Business Workshop
- VectorVest 7 EOD
- VectorVest 7 RealTime/IntraDay
- VectorVest AutoTester
- VectorVest Educational Services
- VectorVest OnLine
- VectorVest Options Analyzer
- VectorVest ProGraphics v6.0
- VectorVest ProTrader 7
- VectorVest RealTime Derby Tool
- VectorVest Simulator
- VectorVest Variator
- VectorVest Watchdog
