HOT TOPICS LIST
- MACD
- Fibonacci
- RSI
- Gann
- ADXR
- Stochastics
- Volume
- Triangles
- Futures
- Cycles
- Volatility
- ZIGZAG
- MESA
- Retracement
- Aroon
INDICATORS LIST
LIST OF TOPICS
PRINT THIS ARTICLE
by Matt Blackman
Yahoo gapped up 14% from $48.35 to close at $56.21 in the wake of better than expected earnings. But this looks like a better short than long candidate and proof that markets are more emotional than efficient.
Position: N/A
Matt Blackman
Matt Blackman is a full-time technical and financial writer and trader. He produces corporate and financial newsletters, and assists clients in getting published in the mainstream media. He is the host of TradeSystemGuru.com. Matt has earned the Chartered Market Technician (CMT) designation. Find out what stocks and futures Matt is watching on Twitter at www.twitter.com/RatioTrade
PRINT THIS ARTICLE
CHART ANALYSIS
Yahoo!? Now Hold On Just A Minute
04/16/04 11:55:20 AMby Matt Blackman
Yahoo gapped up 14% from $48.35 to close at $56.21 in the wake of better than expected earnings. But this looks like a better short than long candidate and proof that markets are more emotional than efficient.
Position: N/A
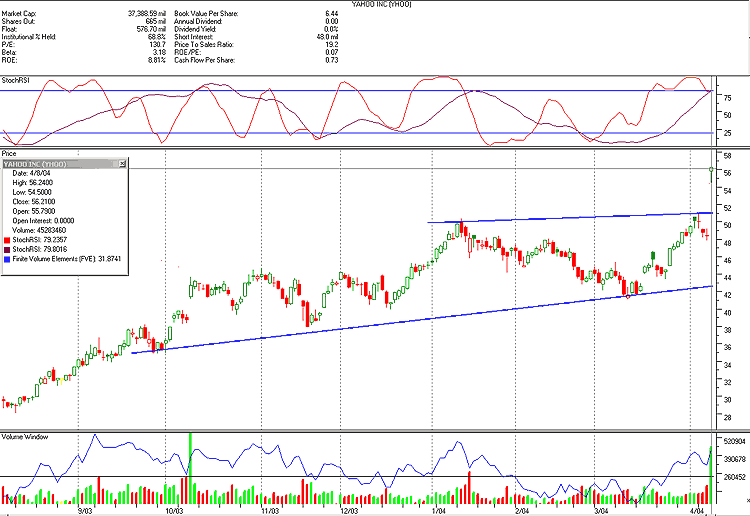
| When Yahoo! Inc. announced earnings after market on April 7, it beat expectations by two pennies. It was enough to vault the price of the stock, which was already expensive, to new heights. A look at both the fundamentals and technicals tell us that anyone buying at this price may be treading on thin ice indeed. |

|
| Figure 1 – Daily chart of Yahoo! Inc. showing price channel (blue lines), bearish island hammer candle on April 8, and overbought stochasticRSI daily and weekly indicators. The finite volume element indicator (blue line in volume window at bottom) is also overbought. Also note fundamental ratios and data in upper window. Certainly looks like a sell to me. Chart provided by www.highgrowthstock.com |
| |
| With a price/earnings ratio (trailing twelve months) of 130.7 and forward P/E (using 2004 earnings estimates) of more than 100 at a stock price of $56.21, investors have clearly gotten ahead of themselves on this one. Other ratios scream overpriced as well. The price/sales ratio is 19.2. A ratio of 3 is high. The book value of $6.44 per share is less than 12% of the current stock price and the price/book ratio about 170% of the industry average. Short interest currently sits at 8.42% of float, well over our 5% short threshold. Short interest jumped from 27.97 million shares last month to 47.97 million in the most recent figures. It would appear that the shorts are certainly loading up the truck on this one. Insiders have also been relatively heavy sellers, having dumped more than 500,000 shares in the last three months and more than 5 million in the last year at prices ranging from $24.00 to $48.00. |
| As Matthew Ingram pointed out in an article for GlobeInvestorGold.com, "It is selling for almost 75 times the profit most analysts expect it to make next year, and about 70 times its operating cash flow or earnings before interest, taxes, depreciation and amortization (EBITDA). By comparison, Amazon.com is trading at 35 times its projected profit for next year, and about 3.5 times its revenue over the past 12-month period." Many would argue that Amazon is overpriced too at a P/E of 80 and price/sales ratio of 6.2. Sellers seem to agree, as 10% of the AMZN float is currently short. This is one clear example that flies in the face of fundamentalists who believe in the efficient market hypothesis and a clear example of investors getting ahead of themselves. Traders who recognize when this occurs and have done their homework, are in a good position to take advantage of the situation. |
Matt Blackman is a full-time technical and financial writer and trader. He produces corporate and financial newsletters, and assists clients in getting published in the mainstream media. He is the host of TradeSystemGuru.com. Matt has earned the Chartered Market Technician (CMT) designation. Find out what stocks and futures Matt is watching on Twitter at www.twitter.com/RatioTrade
| Company: | TradeSystemGuru.com |
| Address: | Box 2589 |
| Garibaldi Highlands, BC Canada | |
| Phone # for sales: | 604-898-9069 |
| Fax: | 604-898-9069 |
| Website: | www.tradesystemguru.com |
| E-mail address: | indextradermb@gmail.com |
Traders' Resource Links | |
| TradeSystemGuru.com has not added any product or service information to TRADERS' RESOURCE. | |
Click here for more information about our publications!
Comments
Date: 04/16/04Rank: 5Comment:
Date: 04/19/04Rank: 5Comment:

|

Request Information From Our Sponsors
- StockCharts.com, Inc.
- Candle Patterns
- Candlestick Charting Explained
- Intermarket Technical Analysis
- John Murphy on Chart Analysis
- John Murphy's Chart Pattern Recognition
- John Murphy's Market Message
- MurphyExplainsMarketAnalysis-Intermarket Analysis
- MurphyExplainsMarketAnalysis-Visual Analysis
- StockCharts.com
- Technical Analysis of the Financial Markets
- The Visual Investor
- VectorVest, Inc.
- Executive Premier Workshop
- One-Day Options Course
- OptionsPro
- Retirement Income Workshop
- Sure-Fire Trading Systems (VectorVest, Inc.)
- Trading as a Business Workshop
- VectorVest 7 EOD
- VectorVest 7 RealTime/IntraDay
- VectorVest AutoTester
- VectorVest Educational Services
- VectorVest OnLine
- VectorVest Options Analyzer
- VectorVest ProGraphics v6.0
- VectorVest ProTrader 7
- VectorVest RealTime Derby Tool
- VectorVest Simulator
- VectorVest Variator
- VectorVest Watchdog
