HOT TOPICS LIST
- MACD
- Fibonacci
- RSI
- Gann
- ADXR
- Stochastics
- Volume
- Triangles
- Futures
- Cycles
- Volatility
- ZIGZAG
- MESA
- Retracement
- Aroon
INDICATORS LIST
LIST OF TOPICS
PRINT THIS ARTICLE
by Jayanthi Gopalakrishnan
Identifying reversals are the key to satisfying results whether you are a position trader or day trader. Generally, the first and last half hour of the trading day reveal great trading opportunities. Here is an example of how to take advantage of the last half hour.
Position: Buy
Jayanthi Gopalakrishnan
PRINT THIS ARTICLE
DAY TRADING
Trading In The Last Half Hour
05/08/00 09:59:35 AMby Jayanthi Gopalakrishnan
Identifying reversals are the key to satisfying results whether you are a position trader or day trader. Generally, the first and last half hour of the trading day reveal great trading opportunities. Here is an example of how to take advantage of the last half hour.
Position: Buy
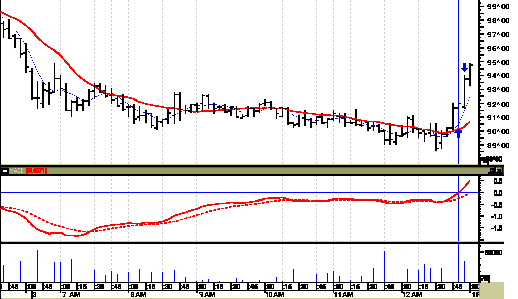
| On 5/3/00 the Nasdaq was in negative territory reaching a low of 3592.79. It wasn't until the last half hour of the trading day that the Nasdaq showed signs of recovering. This was an opportune time to exit any short positions and look to enter long ones. An example of one such stock is JDS Uniphase (JDSU). By using two indicators, namely the moving average crossovers and the moving average convergence divergence (MACD), you could have taken advantage of the upward price movement in the last ten minutes of the trading day. |
| On the chart you can see an overlay of the 5- and 15-day moving averages as well as the MACD plotted in a separate window. At 12:50 pm the 5-day moving average crossed above the 15-day moving average and the MACD crossed above zero. At this time you should enter your long position at around 91.5 as identified by the arrow. Since the market will close in ten minutes you should not hesitate to exit your position as soon as you have reached your profit objective. An exit at 93.75, identified by the second arrow, would have given you a substantial profit. |

|
| A buy signal was confirmed ten minutes before the close on 5/3/00. The trade resulted in a 2 1/4 point gain. |
| Graphic provided by: MetaStock. |
| |
| Title: | Editor |
| Company: | Technical Analysis of Stocks & Commodities |
| Address: | 4757 California Ave SW |
| Seattle, WA 98116 | |
| Website: | Traders.com |
| E-mail address: | Jayanthi@traders.com |
Traders' Resource Links | |
| Charting the Stock Market: The Wyckoff Method -- Books | |
| Working-Money.com -- Online Trading Services | |
| Traders.com Advantage -- Online Trading Services | |
| Technical Analysis of Stocks & Commodities -- Publications and Newsletters | |
| Working Money, at Working-Money.com -- Publications and Newsletters | |
| Traders.com Advantage -- Publications and Newsletters | |
| Professional Traders Starter Kit -- Software | |
Click here for more information about our publications!
Comments
Date: / /Rank: 5Comment:

Request Information From Our Sponsors
- VectorVest, Inc.
- Executive Premier Workshop
- One-Day Options Course
- OptionsPro
- Retirement Income Workshop
- Sure-Fire Trading Systems (VectorVest, Inc.)
- Trading as a Business Workshop
- VectorVest 7 EOD
- VectorVest 7 RealTime/IntraDay
- VectorVest AutoTester
- VectorVest Educational Services
- VectorVest OnLine
- VectorVest Options Analyzer
- VectorVest ProGraphics v6.0
- VectorVest ProTrader 7
- VectorVest RealTime Derby Tool
- VectorVest Simulator
- VectorVest Variator
- VectorVest Watchdog
- StockCharts.com, Inc.
- Candle Patterns
- Candlestick Charting Explained
- Intermarket Technical Analysis
- John Murphy on Chart Analysis
- John Murphy's Chart Pattern Recognition
- John Murphy's Market Message
- MurphyExplainsMarketAnalysis-Intermarket Analysis
- MurphyExplainsMarketAnalysis-Visual Analysis
- StockCharts.com
- Technical Analysis of the Financial Markets
- The Visual Investor
