HOT TOPICS LIST
- MACD
- Fibonacci
- RSI
- Gann
- ADXR
- Stochastics
- Volume
- Triangles
- Futures
- Cycles
- Volatility
- ZIGZAG
- MESA
- Retracement
- Aroon
INDICATORS LIST
LIST OF TOPICS
PRINT THIS ARTICLE
by Koos van der Merwe
The Put/Call ratio is simply the number of put options contracts traded in a given day divided by the number of call options contracts traded that same day. The put volume divided by the call volume yields the Put/Call ratio.
Position: Buy
Koos van der Merwe
Has been a technical analyst since 1969, and has worked as a futures and options trader with First Financial Futures in Johannesburg, South Africa.
PRINT THIS ARTICLE
TRADING SYSTEMS
Using An Inverted Put/Call Ratio To Trade The QQQs
04/08/04 11:45:19 AMby Koos van der Merwe
The Put/Call ratio is simply the number of put options contracts traded in a given day divided by the number of call options contracts traded that same day. The put volume divided by the call volume yields the Put/Call ratio.
Position: Buy
| Put options are used by speculators who believe that a certain index or security is going down. Call options are used when they believe that an index or security is going up. At the end of each day all these individual trades are tallied up and collated. The custodian of the Put/Call ratio is the venerable Chicago Board Options Exchange. The CBOE was founded in April 1973 and revolutionized options trading by standardizing options so they could be traded on exchanges just like any other security. More options contracts are traded through the CBOE each day than on any other exchange on Earth. The CBOE claims they handle 51% of all options traded in the U.S. and 91% of all index options trading volume. |
| At the end of each trading day the CBOE adds up all the put options and call options traded on both specific stocks and broad stock indexes. The total put volume is divided by the total call volume, and the Put/Call ratio is reported. Can this ratio be used to trade the QQQs? My charts say yes. |

|
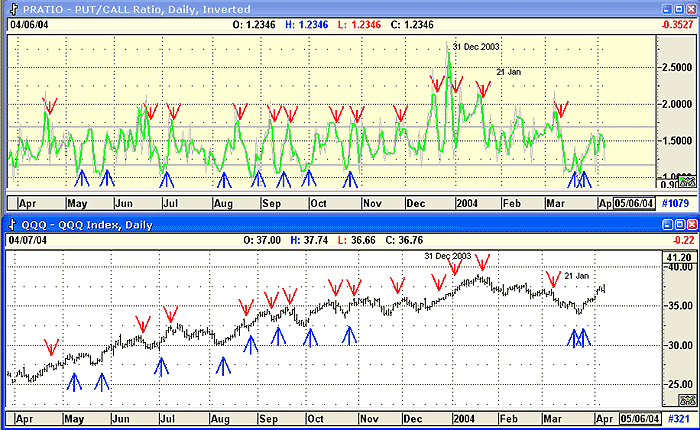
| Figure 1: Inverted Put/Call ratio and the QQQs. |
| Graphic provided by: AdvancedGET. |
| |
| The chart shows the Put/Call ratio inverted, with the buy signal at the bottom, and the sell signal at the top. The ratio is in the upper screen and the QQQs are in the lower screen. To reduce the noise of the ratio, and to more aptly define buy and sell signals, I have placed a 2-period normal moving average of the close on the ratio. This moving average is in green, and gives me the buy/sell signals. The ratio is in light gray. You can easily see how volatile the ratio is compared to the moving average which appears to be calling the turns with considerable accuracy. The two horizontal lines are set at a level chosen to give the best buy/sell signal. |
| The bottom chart is that of the QQQs. I have shown the buy and sell signal positions given by the Put/Call ratio on the chart. You can eyeball the buy and sell signals, and the success of the system. A position is closed either on a stop-loss or on a reversing signal. Only one error signal was given on December 31, 2003, when the ratio gave a sell signal that was much too early. However, how many players would there have been in the market over New Year's Eve, or in a market that would be open only half a day? |
| For traders of the QQQs, whether buying on the market or trading in options, here is an indicator that can help in decision-making. |
Has been a technical analyst since 1969, and has worked as a futures and options trader with First Financial Futures in Johannesburg, South Africa.
| Address: | 3256 West 24th Ave |
| Vancouver, BC | |
| Phone # for sales: | 6042634214 |
| E-mail address: | petroosp@gmail.com |
Click here for more information about our publications!
Comments
Date: 04/13/04Rank: 4Comment: I could not tell what the buy and sell signals were. It appears that the moving average must cross down (for a sell) and cross up (for a buy) some levels, but I could not tell what they were. Please help.
Thanks
Jan P.
Date: 04/15/04Rank: 3Comment:
Date: 04/18/04Rank: 1Comment:

Request Information From Our Sponsors
- StockCharts.com, Inc.
- Candle Patterns
- Candlestick Charting Explained
- Intermarket Technical Analysis
- John Murphy on Chart Analysis
- John Murphy's Chart Pattern Recognition
- John Murphy's Market Message
- MurphyExplainsMarketAnalysis-Intermarket Analysis
- MurphyExplainsMarketAnalysis-Visual Analysis
- StockCharts.com
- Technical Analysis of the Financial Markets
- The Visual Investor
- VectorVest, Inc.
- Executive Premier Workshop
- One-Day Options Course
- OptionsPro
- Retirement Income Workshop
- Sure-Fire Trading Systems (VectorVest, Inc.)
- Trading as a Business Workshop
- VectorVest 7 EOD
- VectorVest 7 RealTime/IntraDay
- VectorVest AutoTester
- VectorVest Educational Services
- VectorVest OnLine
- VectorVest Options Analyzer
- VectorVest ProGraphics v6.0
- VectorVest ProTrader 7
- VectorVest RealTime Derby Tool
- VectorVest Simulator
- VectorVest Variator
- VectorVest Watchdog
