HOT TOPICS LIST
- MACD
- Fibonacci
- RSI
- Gann
- ADXR
- Stochastics
- Volume
- Triangles
- Futures
- Cycles
- Volatility
- ZIGZAG
- MESA
- Retracement
- Aroon
INDICATORS LIST
LIST OF TOPICS
PRINT THIS ARTICLE
by Kevin Hopson
As expected, Ford Motor Co. put in a short-term bottom last month. However, given recent developments and continued pessimism towards the company, Ford could have much higher to go.
Position: Accumulate
Kevin Hopson
Kevin has been a technical analyst for roughly 10 years now. Previously, Kevin owned his own business and acted as a registered investment advisor, specializing in energy. He was also a freelance oil analyst for Orient Trading Co., a commodity futures trading firm in Japan. Kevin is currently a freelance writer.
PRINT THIS ARTICLE
TECHNICAL ANALYSIS
Ford Is Trucking Along
04/06/04 09:05:19 AMby Kevin Hopson
As expected, Ford Motor Co. put in a short-term bottom last month. However, given recent developments and continued pessimism towards the company, Ford could have much higher to go.
Position: Accumulate
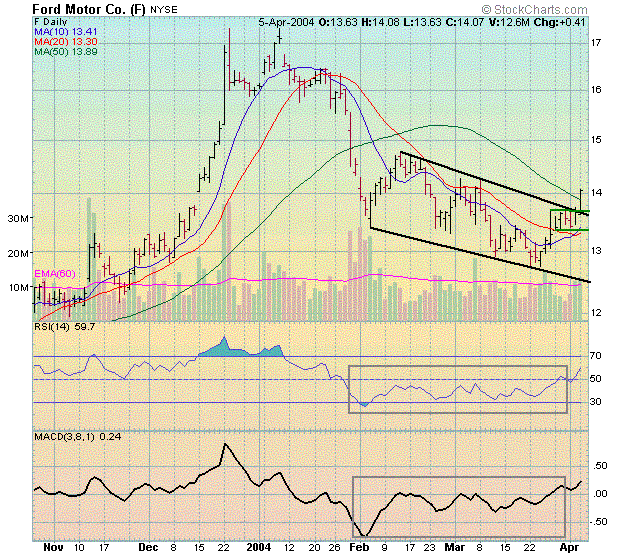
| I touched on Ford Motor Co. (F) in early March, as the stock appeared to be in the late stages of a bottoming pattern. My reasons for this were bullish divergences in the relative strength index (RSI) and moving average convergence/divergence (MACD), as well as overly pessimistic market sentiment towards the stock. If you look at the five-month chart for Ford, you will notice that the RSI and MACD were putting in higher lows despite the fact that the stock price continued to move lower. Coupled with huge short interest and negative analyst ratings (consensus), it was apparent that Ford was close to putting in a bottom. |
| This ended up being the case. Since bottoming out around the $12.70 level, Ford has proceeded to clear its 10-, 20- and 50-day moving averages, which the stock had previously not traded above since early this year. In doing so, the stock also moved above February's downtrend line (top of the falling channel) and broke out of a bullish trading range, as illustrated by the green lines. As a result, recent developments for the stock have been very bullish. |

|
| Graphic provided by: Stockcharts.com. |
| |
| Still, investors and analysts have showed no signs of turning positive on the company. Short interest rose from 78.1M shares on Feb. 9 to 87.4M shares on March 8. This is an increase of nearly 12 percent and would take almost 9 days for shorts to cover based on the stock's average daily volume. Additionally, only three of the 15 analysts covering the company currently have a buy rating on the stock. This constitutes a lot of potential buying pressure to push Ford higher down the road. As a result, I would continue to hold Ford and look to accumulate on any significant weakness. In the meantime, it appears that $14.50 could be the next upside target, as this is the site of the 38.2 percent retracement level from the January-March decline. |
Kevin has been a technical analyst for roughly 10 years now. Previously, Kevin owned his own business and acted as a registered investment advisor, specializing in energy. He was also a freelance oil analyst for Orient Trading Co., a commodity futures trading firm in Japan. Kevin is currently a freelance writer.
| Glen Allen, VA | |
| E-mail address: | hopson_1@yahoo.com |
Click here for more information about our publications!
PRINT THIS ARTICLE

Request Information From Our Sponsors
- StockCharts.com, Inc.
- Candle Patterns
- Candlestick Charting Explained
- Intermarket Technical Analysis
- John Murphy on Chart Analysis
- John Murphy's Chart Pattern Recognition
- John Murphy's Market Message
- MurphyExplainsMarketAnalysis-Intermarket Analysis
- MurphyExplainsMarketAnalysis-Visual Analysis
- StockCharts.com
- Technical Analysis of the Financial Markets
- The Visual Investor
- VectorVest, Inc.
- Executive Premier Workshop
- One-Day Options Course
- OptionsPro
- Retirement Income Workshop
- Sure-Fire Trading Systems (VectorVest, Inc.)
- Trading as a Business Workshop
- VectorVest 7 EOD
- VectorVest 7 RealTime/IntraDay
- VectorVest AutoTester
- VectorVest Educational Services
- VectorVest OnLine
- VectorVest Options Analyzer
- VectorVest ProGraphics v6.0
- VectorVest ProTrader 7
- VectorVest RealTime Derby Tool
- VectorVest Simulator
- VectorVest Variator
- VectorVest Watchdog
