HOT TOPICS LIST
- MACD
- Fibonacci
- RSI
- Gann
- ADXR
- Stochastics
- Volume
- Triangles
- Futures
- Cycles
- Volatility
- ZIGZAG
- MESA
- Retracement
- Aroon
INDICATORS LIST
LIST OF TOPICS
PRINT THIS ARTICLE
by David Penn
How intraday technical analysis saw the collapse in Treasury notes.
Position: N/A
David Penn
Technical Writer for Technical Analysis of STOCKS & COMMODITIES magazine, Working-Money.com, and Traders.com Advantage.
PRINT THIS ARTICLE
HEAD & SHOULDERS
The 10-Year Treasury's Hourly Head And Shoulders Top
04/06/04 09:47:26 AMby David Penn
How intraday technical analysis saw the collapse in Treasury notes.
Position: N/A
| On Friday, April 2nd -- in the immediate wake of an upside surprise in the job growth numbers for March 2004 -- the bond market took it on the chin. Fearing that with the last leg of the economic recovery screwed into place (meaning the problem of anemic job creation), the table for higher interest rates was now set, bond traders stampeded for the exits. The sell-off was made worse by two factors -- one actual and the other alleged -- involving both a large number of bond bulls caught trying to unload positions all at once and the rumor that the jobs data had been leaked in advance. But no matter how you slice it, the April 2nd rout was a ROUT. Basis June, the 10-year treasury fell from just over 114 '26 to 112 '5, as yields leapt from 3.90 to 4.17. |
| There was no way of knowing in advance what the jobs number would be -- though it was pretty easy to figure that a strong report would likely be a negative for bonds. But assuming you're a trader, not an economist -- and assuming further that you weren't on that alleged "pre-announcement" leak -- was there any way of knowing that -- from a probability standpoint -- bonds were more likely to fall than to rise? |

|
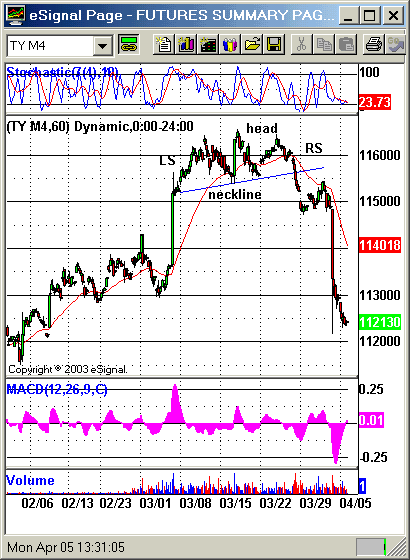
| Figure 1: This head and shoulders top in the hourly chart of June T-notes anticipated a significant collapse in bond prices. Bonds crashed through their projected downside of about 114 '16. |
| Graphic provided by: eSignal. |
| |
| You certainly might have if you'd been paying attention to intraday (i.e., hourly) trading in bond futures. Over the course of March, government long bonds had been tracing out a fairly clear head and shoulders top pattern, a pattern that sprang into life late on March 1st as the stock market was making a top. |
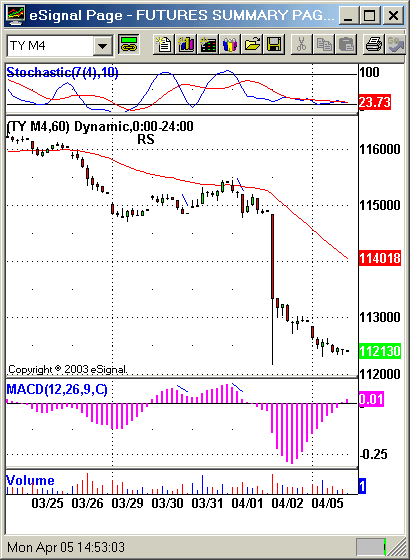
 Figure 2: The first MACDH peak produced a losing short opportunity. But the second offered short sellers the kind of "waterfall" trade that more than makes up for previous small losses. Let's take a closer look at the head and shoulders top itself. The left shoulder of this pattern formed from March 5th to the 16th, the head section from the 16th to March 19th, and the right shoulder from the 19th to the 26th. The high point of the formation was about 116 '17.5 and the low point was 115 '12, setting up a minimum downside of 114 '6.5. The head and shoulders top actually slopes upward as we move to the right, but its "breakdown" level is near the level of the pattern's low point -- thus posing no problems for the basic measurement rule (formation size subtracted from value at the "neckline"). |
| Interestingly, after a fairly sharp breakdown below 115, TYM4 stopped as if suspended in mid-air and moved back up toward the neckline as if to test that level for resistance. Post-breakout/breakdown pullbacks are to be expected with many patterns, and head and shoulders patterns are no exception. In this case, TYM4 fell to 114 '22.5 on the initial breakdown, then bounced almost a full point to 115 '16. This bounce, incidentally, brought the June T-note to just barely above its 50-hour exponential moving average. Combined, however, with an overbought stochastic and a positive MACDH, TYM4's bounce looked imminently sellable -- which it turned out to be mere days later. |
Technical Writer for Technical Analysis of STOCKS & COMMODITIES magazine, Working-Money.com, and Traders.com Advantage.
| Title: | Technical Writer |
| Company: | Technical Analysis, Inc. |
| Address: | 4757 California Avenue SW |
| Seattle, WA 98116 | |
| Phone # for sales: | 206 938 0570 |
| Fax: | 206 938 1307 |
| Website: | www.Traders.com |
| E-mail address: | DPenn@traders.com |
Traders' Resource Links | |
| Charting the Stock Market: The Wyckoff Method -- Books | |
| Working-Money.com -- Online Trading Services | |
| Traders.com Advantage -- Online Trading Services | |
| Technical Analysis of Stocks & Commodities -- Publications and Newsletters | |
| Working Money, at Working-Money.com -- Publications and Newsletters | |
| Traders.com Advantage -- Publications and Newsletters | |
| Professional Traders Starter Kit -- Software | |
Click here for more information about our publications!
Comments
Date: 04/12/04Rank: 4Comment:

Request Information From Our Sponsors
- VectorVest, Inc.
- Executive Premier Workshop
- One-Day Options Course
- OptionsPro
- Retirement Income Workshop
- Sure-Fire Trading Systems (VectorVest, Inc.)
- Trading as a Business Workshop
- VectorVest 7 EOD
- VectorVest 7 RealTime/IntraDay
- VectorVest AutoTester
- VectorVest Educational Services
- VectorVest OnLine
- VectorVest Options Analyzer
- VectorVest ProGraphics v6.0
- VectorVest ProTrader 7
- VectorVest RealTime Derby Tool
- VectorVest Simulator
- VectorVest Variator
- VectorVest Watchdog
- StockCharts.com, Inc.
- Candle Patterns
- Candlestick Charting Explained
- Intermarket Technical Analysis
- John Murphy on Chart Analysis
- John Murphy's Chart Pattern Recognition
- John Murphy's Market Message
- MurphyExplainsMarketAnalysis-Intermarket Analysis
- MurphyExplainsMarketAnalysis-Visual Analysis
- StockCharts.com
- Technical Analysis of the Financial Markets
- The Visual Investor
