HOT TOPICS LIST
- MACD
- Fibonacci
- RSI
- Gann
- ADXR
- Stochastics
- Volume
- Triangles
- Futures
- Cycles
- Volatility
- ZIGZAG
- MESA
- Retracement
- Aroon
INDICATORS LIST
LIST OF TOPICS
PRINT THIS ARTICLE
by Jayanthi Gopalakrishnan
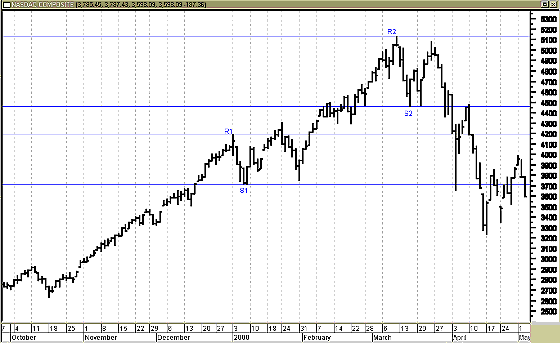
Support and resistance levels can reveal important information about price activity in the markets. The chart of the Nasdaq Composite chart shows how, by taking note of these support and resistance levels, you could have exited any open positions prior to the sharp sell-off experienced by the technology sector.
Position: N/A
Jayanthi Gopalakrishnan
PRINT THIS ARTICLE
SUPPORT & RESISTANCE
Support And Resistance Levels
05/08/00 10:40:21 AMby Jayanthi Gopalakrishnan
Support and resistance levels can reveal important information about price activity in the markets. The chart of the Nasdaq Composite chart shows how, by taking note of these support and resistance levels, you could have exited any open positions prior to the sharp sell-off experienced by the technology sector.
Position: N/A
| In Figure 1 the line labeled R1 refers to the first resistance level, and S1 refers to the first support level. On 1/3/00 the Nasdaq reached a significant high followed by a sharp decline on 1/4/00. These points will be your initial support and resistance levels. If prices drift below the support level it is an indication that prices may drift down further and you should close all your long positions. The resistance level is also of significance. If prices move above the resistance level it is a positive sign implying that the retracement to S1 is merely a correction in a bull market. If prices do not move above the resistance level it is an indication that the bull rally might be preparing for a trend reversal. Here, prices did not go below the support level but did go above the resistance level indicating that the bull market was likely to continue. |
| The Nasdaq rally continued til it reached its all-time high on 3/10/00 (R2). This should have been your next resistance level. After hitting this high the index retraced, reaching a low of 4455 (S2). The action after this retracement revealed an interesting point. Prices failed to go above the second resistance level suggesting that the bull market had lost its steam. For those wanting additional confirmation, once prices went below the second support level, the Nasdaq experienced a sharp sell-off. |

|
| Support and resistance levels are critical in determining entry and exit points in your trading system. |
| Graphic provided by: MetaStock. |
| |
| Keeping tabs on these key support and resistance levels can help in making important trading decisions. You could have avoided the technology sell-off by exiting your long positions when you were alerted to signals implying the rally may have come to an end. |
| Title: | Editor |
| Company: | Technical Analysis of Stocks & Commodities |
| Address: | 4757 California Ave SW |
| Seattle, WA 98116 | |
| Website: | Traders.com |
| E-mail address: | Jayanthi@traders.com |
Traders' Resource Links | |
| Charting the Stock Market: The Wyckoff Method -- Books | |
| Working-Money.com -- Online Trading Services | |
| Traders.com Advantage -- Online Trading Services | |
| Technical Analysis of Stocks & Commodities -- Publications and Newsletters | |
| Working Money, at Working-Money.com -- Publications and Newsletters | |
| Traders.com Advantage -- Publications and Newsletters | |
| Professional Traders Starter Kit -- Software | |
Click here for more information about our publications!
Comments

Request Information From Our Sponsors
- VectorVest, Inc.
- Executive Premier Workshop
- One-Day Options Course
- OptionsPro
- Retirement Income Workshop
- Sure-Fire Trading Systems (VectorVest, Inc.)
- Trading as a Business Workshop
- VectorVest 7 EOD
- VectorVest 7 RealTime/IntraDay
- VectorVest AutoTester
- VectorVest Educational Services
- VectorVest OnLine
- VectorVest Options Analyzer
- VectorVest ProGraphics v6.0
- VectorVest ProTrader 7
- VectorVest RealTime Derby Tool
- VectorVest Simulator
- VectorVest Variator
- VectorVest Watchdog
- StockCharts.com, Inc.
- Candle Patterns
- Candlestick Charting Explained
- Intermarket Technical Analysis
- John Murphy on Chart Analysis
- John Murphy's Chart Pattern Recognition
- John Murphy's Market Message
- MurphyExplainsMarketAnalysis-Intermarket Analysis
- MurphyExplainsMarketAnalysis-Visual Analysis
- StockCharts.com
- Technical Analysis of the Financial Markets
- The Visual Investor
