HOT TOPICS LIST
- MACD
- Fibonacci
- RSI
- Gann
- ADXR
- Stochastics
- Volume
- Triangles
- Futures
- Cycles
- Volatility
- ZIGZAG
- MESA
- Retracement
- Aroon
INDICATORS LIST
LIST OF TOPICS
PRINT THIS ARTICLE
by Ashwani Gujral
Qualcomm has formed a rounding bottom on a weekly basis and is making multi-year highs. It can be expected to head to the $88 level once $70 is taken out.
Position: N/A
Ashwani Gujral
He is founder of AGIP Securities Pvt. Ltd. which offers money management services, live chat rooms (during market hours) and independent technical analysis consultancy. The company has a big media presence from the likes of CNBC, NDTV Profit, and ZEE Business.
PRINT THIS ARTICLE
CHART ANALYSIS
Qualcomm Shows Strength While The Other Techs Stumble
04/09/04 10:27:56 AMby Ashwani Gujral
Qualcomm has formed a rounding bottom on a weekly basis and is making multi-year highs. It can be expected to head to the $88 level once $70 is taken out.
Position: N/A
| Strong stocks move sideways when broad corrections occur in the markets. When markets are trading in wide, two-way price moves, traders should look for stocks in long-term uptrends, wait for them to go into sideways consolidations, and enter as they break out. The ADX, or average directional index, is one of the guiding indicators when looking for strong trends. The ADX is used to identify trending versus trading range-type of markets. It defines the degree, or strength, of a trend, although not the direction. In general, the ADX shows strength in a trend when it is rising from 15 to about 40 and shows a consolidation when it's declining from 40 back to about 15. Under a level of 20, it indicates that the market is likely to move in small swings. |
| I use the ADX to find a stock in strong weekly trend, then try to enter on a correction in the daily chart. This way I get low risk, high percentage trades. To enter on the daily chart, I use an oscillator such as the 7,10 stochastics or the 20-day SMA, and wait for them to reach oversold levels. This strategy can be employed on any two time frames, not just weekly and daily. This strategy does not have the sophistication or the complication to look impressive, but 95% of all successful trading is simple, and this one can be quite successful. |

|
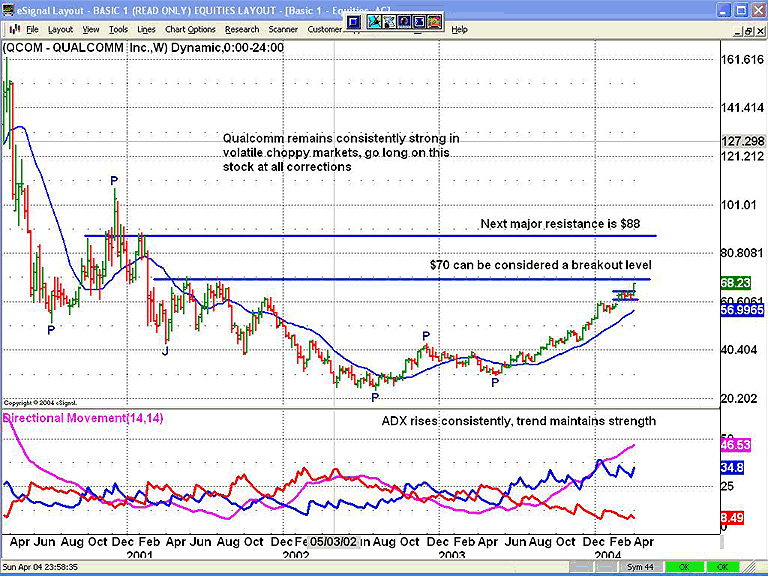
| Figure 1: Weekly chart of Qualcomm. |
| Graphic provided by: eSignal. |
| |
| On the weekly chart, Qualcomm has traced out a rounding bottom and is consistently achieving higher levels. The weekly ADX supports this and has been over 20 for the last 32 weeks. During the recent correction in the Dow and Nasdaq, the worst Qualcomm did was move sideways. Hence it makes for a perfect candidate to go long as soon as the market starts another upswing. As you can see on the chart, Qualcomm immediately broke out of its sideways pattern last week when the markets began moving higher. If Qualcomm breaks through the $70 level, it is headed to $88 as the first target, although I see much higher levels for it in the future. The $88 figure is just the first major resistance visible on the chart. |
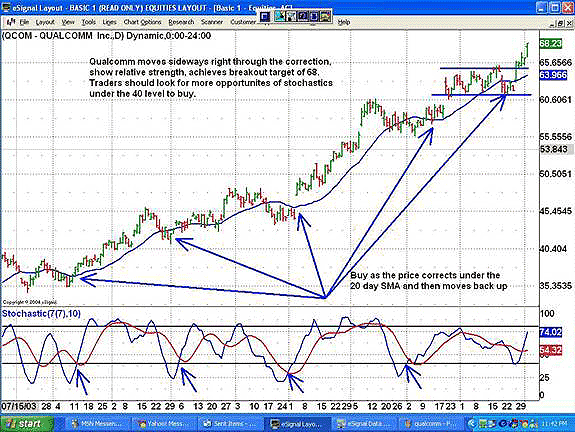
 Figure 2: Daily chart of Qualcomm. On the daily chart, I will go through two extremely simple techniques for going long on corrections. The first technique consists of drawing a 20-day SMA around the price and going long as soon as the price goes below the average and turns back upwards over it. The second technique uses the 7,10 stochastics indicator. Traders should go long each time the stochatics fast line%K and slow line %D line go below the oversold levels (I am using the 40 level as it provides more buy signals) and then the fast line turns back and crosses over the slow line, as marked by the arrows. These methods can be used together to get better filtering and enhanced signals. That is certainly the way I use them. |
He is founder of AGIP Securities Pvt. Ltd. which offers money management services, live chat rooms (during market hours) and independent technical analysis consultancy. The company has a big media presence from the likes of CNBC, NDTV Profit, and ZEE Business.
| Title: | Chief mkt strategist |
| Company: | AGIP Securities |
| India | |
| Phone # for sales: | 9871066337 |
| Website: | www.ashwanigujral.com |
| E-mail address: | contact@ashwanigujral.com |
Traders' Resource Links | |
| AGIP Securities has not added any product or service information to TRADERS' RESOURCE. | |
Click here for more information about our publications!
Comments
Date: 04/13/04Rank: 5Comment:
Date: 04/13/04Rank: 3Comment:

Request Information From Our Sponsors
- StockCharts.com, Inc.
- Candle Patterns
- Candlestick Charting Explained
- Intermarket Technical Analysis
- John Murphy on Chart Analysis
- John Murphy's Chart Pattern Recognition
- John Murphy's Market Message
- MurphyExplainsMarketAnalysis-Intermarket Analysis
- MurphyExplainsMarketAnalysis-Visual Analysis
- StockCharts.com
- Technical Analysis of the Financial Markets
- The Visual Investor
- VectorVest, Inc.
- Executive Premier Workshop
- One-Day Options Course
- OptionsPro
- Retirement Income Workshop
- Sure-Fire Trading Systems (VectorVest, Inc.)
- Trading as a Business Workshop
- VectorVest 7 EOD
- VectorVest 7 RealTime/IntraDay
- VectorVest AutoTester
- VectorVest Educational Services
- VectorVest OnLine
- VectorVest Options Analyzer
- VectorVest ProGraphics v6.0
- VectorVest ProTrader 7
- VectorVest RealTime Derby Tool
- VectorVest Simulator
- VectorVest Variator
- VectorVest Watchdog
