HOT TOPICS LIST
- MACD
- Fibonacci
- RSI
- Gann
- ADXR
- Stochastics
- Volume
- Triangles
- Futures
- Cycles
- Volatility
- ZIGZAG
- MESA
- Retracement
- Aroon
INDICATORS LIST
LIST OF TOPICS
PRINT THIS ARTICLE
by Ashwani Gujral
When the weekly and daily charts show contradictory signals, weekly patterns generally prevail. The Swiss Franc futures shows a bearish daily chart and an upward channel on the weekly chart. The first step to trading such patterns is to reduce your trading volumes.
Position: N/A
Ashwani Gujral
He is founder of AGIP Securities Pvt. Ltd. which offers money management services, live chat rooms (during market hours) and independent technical analysis consultancy. The company has a big media presence from the likes of CNBC, NDTV Profit, and ZEE Business.
PRINT THIS ARTICLE
CHART ANALYSIS
Swiss Franc Futures Give Contrary Daily And Weekly Signals
04/08/04 11:50:21 AMby Ashwani Gujral
When the weekly and daily charts show contradictory signals, weekly patterns generally prevail. The Swiss Franc futures shows a bearish daily chart and an upward channel on the weekly chart. The first step to trading such patterns is to reduce your trading volumes.
Position: N/A
| Let me be clear about one thing: conflicting patterns across time frames generally should be avoided when you're screening for tradable patterns. But sometimes a key index or a currency shows this pattern and there is no option but to trade it. In this case, invariably the pattern in the lower time frame fails and the pattern in the higher time frame prevails. That said, generally a weekly pattern in this situation isn't very strong, and therefore abundant caution, a good entry, and lower volumes are advised as the moves might not go as expected. The Swiss Franc example below illustrates that real life trading is a lot more complex than perfect theoretical examples. |

|
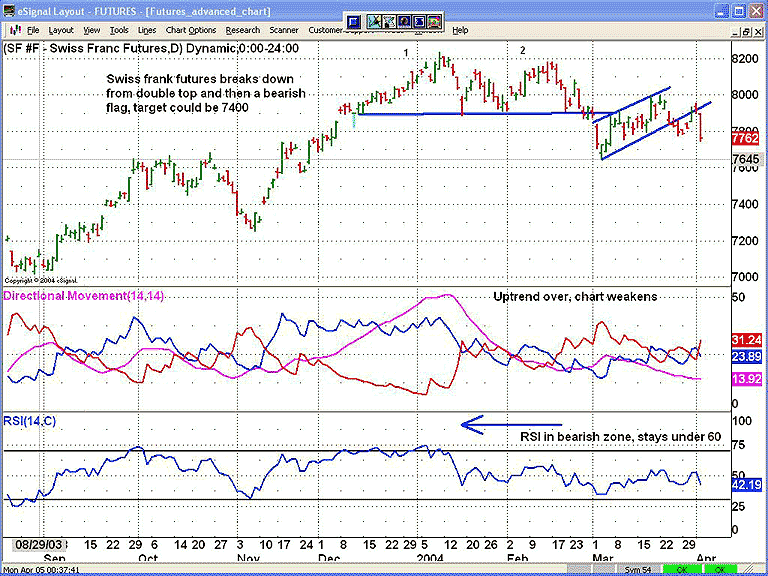
| Figure 1: Daily chart of the Swiss Franc futures. |
| Graphic provided by: eSignal. |
| |
| The Swiss Franc futures daily chart shows a double top pattern with a target of 7600 (the height of the tops from the flat line extrapolated under the flat line). From there we have a flag formation which gives a downside target of 7400 (the drop from point 2 to the bottom of the flag subtracted from the top of the flag). The first sign of suspicion is that the ADX is below 20. An ADX<20 indicates narrow swings and a lack of trending strength. Any ADX<20 should be a warning that either the pattern will fail or it won't reach its price target, and the trade is best done with lower volumes. The daily RSI also shows the market is trading with a bearish bias. |
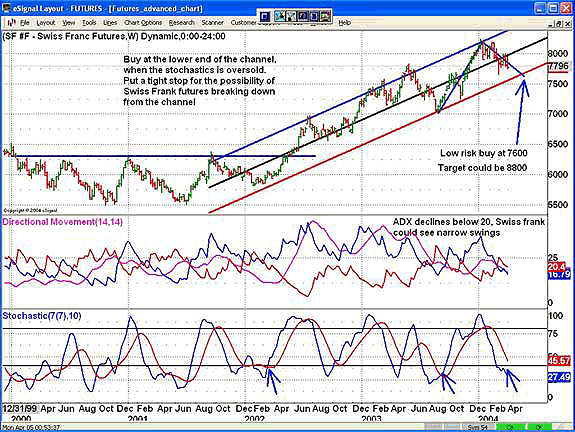
 Figure 2: Weekly chart of Swiss Franc futures. On the weekly chart, the Swiss Franc futures are trading in an upward channel. Note that prices are headed towards the lower end of the channel. Along with this, the 7,10 stochastics oscillator is in the oversold territory. Ideally, at this point we should stop thinking about going short. The weekly ADX is also showing a consolidation instead of a trending phase, so we should wait for the price to hit the lower end of the channel and the fast line (%K) to cross over the (%D) line before taking a long trade. The stops in these trades should be close because all channels do break down or break out after a while. The possibility of this happening appears low because the market is already in oversold territory. But the possibility always exists. The stochastics filter has given two signals before this one, as shown by the arrows, and both have given decent tradable upmoves. In choppy markets, moving in wide 2-way swings, enhanced filters and going with the higher time frame generally does the job. But these are obviously not the easiest trades, so the best way of not losing on them is by not taking them. |
He is founder of AGIP Securities Pvt. Ltd. which offers money management services, live chat rooms (during market hours) and independent technical analysis consultancy. The company has a big media presence from the likes of CNBC, NDTV Profit, and ZEE Business.
| Title: | Chief mkt strategist |
| Company: | AGIP Securities |
| India | |
| Phone # for sales: | 9871066337 |
| Website: | www.ashwanigujral.com |
| E-mail address: | contact@ashwanigujral.com |
Traders' Resource Links | |
| AGIP Securities has not added any product or service information to TRADERS' RESOURCE. | |
Click here for more information about our publications!
Comments
Date: 04/08/04Rank: Comment: ?!
the weekly channel is pure fantasy
Date: 04/08/04Rank: 5Comment:

Request Information From Our Sponsors
- StockCharts.com, Inc.
- Candle Patterns
- Candlestick Charting Explained
- Intermarket Technical Analysis
- John Murphy on Chart Analysis
- John Murphy's Chart Pattern Recognition
- John Murphy's Market Message
- MurphyExplainsMarketAnalysis-Intermarket Analysis
- MurphyExplainsMarketAnalysis-Visual Analysis
- StockCharts.com
- Technical Analysis of the Financial Markets
- The Visual Investor
- VectorVest, Inc.
- Executive Premier Workshop
- One-Day Options Course
- OptionsPro
- Retirement Income Workshop
- Sure-Fire Trading Systems (VectorVest, Inc.)
- Trading as a Business Workshop
- VectorVest 7 EOD
- VectorVest 7 RealTime/IntraDay
- VectorVest AutoTester
- VectorVest Educational Services
- VectorVest OnLine
- VectorVest Options Analyzer
- VectorVest ProGraphics v6.0
- VectorVest ProTrader 7
- VectorVest RealTime Derby Tool
- VectorVest Simulator
- VectorVest Variator
- VectorVest Watchdog
