HOT TOPICS LIST
- MACD
- Fibonacci
- RSI
- Gann
- ADXR
- Stochastics
- Volume
- Triangles
- Futures
- Cycles
- Volatility
- ZIGZAG
- MESA
- Retracement
- Aroon
INDICATORS LIST
LIST OF TOPICS
PRINT THIS ARTICLE
by Ashwani Gujral
Markets are actually in sharp up or downtrends only 30% of the time. Seventy percent of the time, they are either in weak trends or "choppy," moving in a sideways consolidation. The US market seems to be going through a weak trending phase and traders need to be very cautious when entering, as stocks tend to move in large swings in either direction.
Position: N/A
Ashwani Gujral
He is founder of AGIP Securities Pvt. Ltd. which offers money management services, live chat rooms (during market hours) and independent technical analysis consultancy. The company has a big media presence from the likes of CNBC, NDTV Profit, and ZEE Business.
PRINT THIS ARTICLE
CHART ANALYSIS
Citigroup Maintains Uptrend, Breaks Out Of Consolidation
04/06/04 09:32:45 AMby Ashwani Gujral
Markets are actually in sharp up or downtrends only 30% of the time. Seventy percent of the time, they are either in weak trends or "choppy," moving in a sideways consolidation. The US market seems to be going through a weak trending phase and traders need to be very cautious when entering, as stocks tend to move in large swings in either direction.
Position: N/A
| Markets are generally more forgiving in strongly trending phases when exact entries and exits do not matter. In times of weakly trending and choppy markets, it is critical for traders to define the ranges in which the markets are trading and try to catch oversold or overbought extremes. The best method for filtering entries is by drawing a channel across the price pattern and going long (short) when the price touches the lower (upper) end of the channel, confirmed either by the RSI or Stochastics oversold (overbought) situation. This is important because the stock or the market in these cases is likely to show choppy/two way movement and the margin of safety in buying and selling is only possible at extreme levels. Of course, this filter can be further enhanced by using a confluence of daily and weekly charts. |
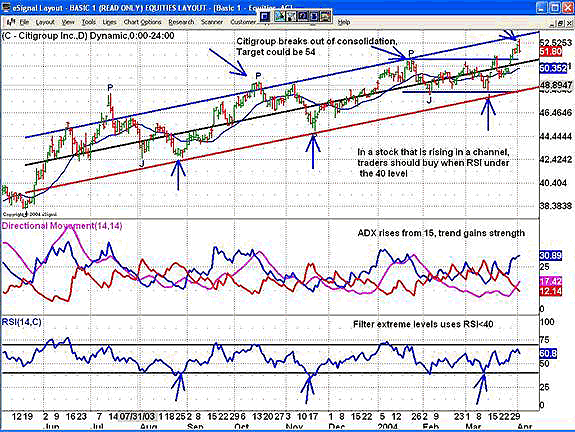
 Figure 1: Daily chart of Citigroup. The daily chart of Citigroup shows large, two way swings on the price chart. From this, I start my analysis by drawing a regression trend channel (available with most trading software) across the price chart, trying my best to fit the lower end of the channel to the rising bottoms and the upper end of the channel to the rising tops. An easier way of doing this is to draw two parallel upward sloping trendlines through the tops and the bottoms. Make sure they capture at least 95% of the price movement. Now I can see that this is not a strongly trending stock. The right way to play this kind of price chart would be to filter long (short) entries when the price hits the lower (higher) end of the channel and filter it with oversold levels under the 40 level. I am using the 40 level as oversold for taking long trades and 60 for going short. This will provide enough signals for me to filter against price extremes in the trend channel. The key to trading such stocks is to trade both sides and keep volumes lower than usual. Also avoid taking big losses and take profits as soon as the price chart touches the extreme part of the channel. As no channel lasts forever, traders should be on the lookout for signs that the channel is breaking out or breaking down. As you can see, the daily trend of Citigroup remains two way, and the ADX has not consistently been able to maintain over 20. Returns will only be maximized if entries are timed as well as possible. |

|
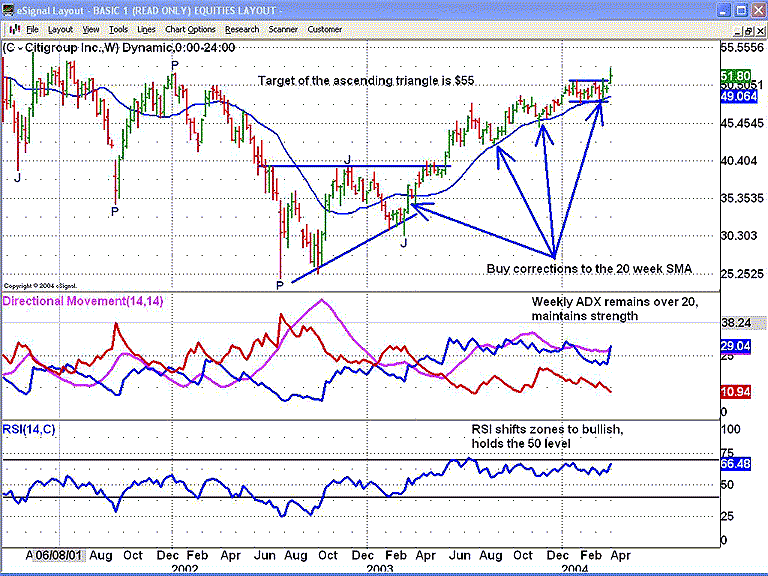
| Figure 2: Weekly charts for Citigroup. |
| Graphic provided by: eSignal. |
| |
| Despite what we have seen on the daily chart, the weekly trend has consistently remained up. A 20-week SMA (simple moving average) can be drawn on the weekly chart and entries on the daily chart can also be filtered by this average. Traders can take long trades whenever the price corrects back to the average or below it and then moves back up. This can be used as a filter for the daily signals. The ADX is maintaining over the 20 level although it is flat and the trend is not gaining further strength. In review, traders need to adjust their trading volumes and strategy based on trend strength and the phase of the market. Two way, choppy movements should be traded at momentum extremes and volumes should be kept lower than in strongly trending markets, and profits and losses should be taken quickly. These are not markets for home runs. |
He is founder of AGIP Securities Pvt. Ltd. which offers money management services, live chat rooms (during market hours) and independent technical analysis consultancy. The company has a big media presence from the likes of CNBC, NDTV Profit, and ZEE Business.
| Title: | Chief mkt strategist |
| Company: | AGIP Securities |
| India | |
| Phone # for sales: | 9871066337 |
| Website: | www.ashwanigujral.com |
| E-mail address: | contact@ashwanigujral.com |
Traders' Resource Links | |
| AGIP Securities has not added any product or service information to TRADERS' RESOURCE. | |
Click here for more information about our publications!
Comments
Date: 04/13/04Rank: 5Comment:

|

Request Information From Our Sponsors
- VectorVest, Inc.
- Executive Premier Workshop
- One-Day Options Course
- OptionsPro
- Retirement Income Workshop
- Sure-Fire Trading Systems (VectorVest, Inc.)
- Trading as a Business Workshop
- VectorVest 7 EOD
- VectorVest 7 RealTime/IntraDay
- VectorVest AutoTester
- VectorVest Educational Services
- VectorVest OnLine
- VectorVest Options Analyzer
- VectorVest ProGraphics v6.0
- VectorVest ProTrader 7
- VectorVest RealTime Derby Tool
- VectorVest Simulator
- VectorVest Variator
- VectorVest Watchdog
- StockCharts.com, Inc.
- Candle Patterns
- Candlestick Charting Explained
- Intermarket Technical Analysis
- John Murphy on Chart Analysis
- John Murphy's Chart Pattern Recognition
- John Murphy's Market Message
- MurphyExplainsMarketAnalysis-Intermarket Analysis
- MurphyExplainsMarketAnalysis-Visual Analysis
- StockCharts.com
- Technical Analysis of the Financial Markets
- The Visual Investor
