HOT TOPICS LIST
- MACD
- Fibonacci
- RSI
- Gann
- ADXR
- Stochastics
- Volume
- Triangles
- Futures
- Cycles
- Volatility
- ZIGZAG
- MESA
- Retracement
- Aroon
INDICATORS LIST
LIST OF TOPICS
PRINT THIS ARTICLE
by Gary Grosschadl
This Ontario based pharmaceutical company has had its share of woes but the chart hints at a possible turn developing.
Position: Hold
Gary Grosschadl
Independent Canadian equities trader and technical analyst based in Peterborough
Ontario, Canada.
PRINT THIS ARTICLE
CHART ANALYSIS
Beleaguered Biovail (BVF.TO) May Be Close To Turning Higher
04/05/04 12:52:29 PMby Gary Grosschadl
This Ontario based pharmaceutical company has had its share of woes but the chart hints at a possible turn developing.
Position: Hold
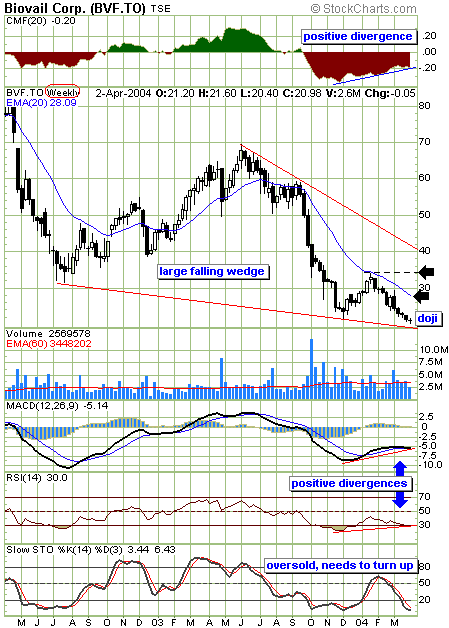
| Biovail trades on both sides of the border and the charts are almost identical. The weekly chart shown below is the Canadian look. Biovail Corporation has been under intense scrutiny since issuing several disappointing financial reports in recent months and this chart shows the slide. |
| This chart suggests a large falling wedge which is considered a bullish pattern. Ideally more than two touches of both upper and lower trendines make for a stronger case but this may still come. Several technical observations make a case for a potential turn. |

|
| Weekly chart of Biovail shows some positive indications. |
| Graphic provided by: Stockcharts.com. |
| |
| Several positive divergences have evolved and when indicators diverge from price pattern, a turn is often not far away. At the top of the chart, the Chaiken money flow indicator shows less bearishness as the stock makes a new recent low. This suggests a bullish bias. The Chaiken indicator is a measure of buying or selling power so it is supply and demand oriented versus momentum-type indicator. The MACD (moving average convergence/divergence) and RSI (relative strength indicator) also show positive divergences to price action. The stochastic indicator shows an oversold condition and should this indicator turn up and move above the 20 level, then a bullish move could be underway. |
| A doji candlestick has emerged which represents indecision or a balance between the bulls and bears. This shift in momentum, when it occurs at tops or bottoms, can often signal a coming turn or reversal. A move above the doji confirms this bullish intent while a move below negates this and leads to a test of the lower trendline. |
| The fact that the stock is belows its 20-period moving average (in this case the 20-week exponential MA) reflects the bearish trend. With this in mind a swing up from here would be considered a possible "failure move" to overhead resistance. This means some traders would target the 20-week EMA as a trading target (either a sell target or a possible shorting target). Currently the 20-week EMA is $28.09 Cdn. Should the bulls prevail above this mark, then the next upside resistance level would be $34 as indicated. The super bull scenario would involve a bold thrust to the top trendline and this would take some time if it occurs, whereas a failure move, if Biovail doesn't rise above overhead resistance, is more likely. |
Independent Canadian equities trader and technical analyst based in Peterborough
Ontario, Canada.
| Website: | www.whatsonsale.ca/financial.html |
| E-mail address: | gwg7@sympatico.ca |
Click here for more information about our publications!
PRINT THIS ARTICLE

Request Information From Our Sponsors
- VectorVest, Inc.
- Executive Premier Workshop
- One-Day Options Course
- OptionsPro
- Retirement Income Workshop
- Sure-Fire Trading Systems (VectorVest, Inc.)
- Trading as a Business Workshop
- VectorVest 7 EOD
- VectorVest 7 RealTime/IntraDay
- VectorVest AutoTester
- VectorVest Educational Services
- VectorVest OnLine
- VectorVest Options Analyzer
- VectorVest ProGraphics v6.0
- VectorVest ProTrader 7
- VectorVest RealTime Derby Tool
- VectorVest Simulator
- VectorVest Variator
- VectorVest Watchdog
- StockCharts.com, Inc.
- Candle Patterns
- Candlestick Charting Explained
- Intermarket Technical Analysis
- John Murphy on Chart Analysis
- John Murphy's Chart Pattern Recognition
- John Murphy's Market Message
- MurphyExplainsMarketAnalysis-Intermarket Analysis
- MurphyExplainsMarketAnalysis-Visual Analysis
- StockCharts.com
- Technical Analysis of the Financial Markets
- The Visual Investor
