HOT TOPICS LIST
- MACD
- Fibonacci
- RSI
- Gann
- ADXR
- Stochastics
- Volume
- Triangles
- Futures
- Cycles
- Volatility
- ZIGZAG
- MESA
- Retracement
- Aroon
INDICATORS LIST
LIST OF TOPICS
PRINT THIS ARTICLE
by Kevin Hopson
May crude oil has been hitting new highs in recent months but the head and shoulders breakdown could indicate a correction in the near-term.
Position: N/A
Kevin Hopson
Kevin has been a technical analyst for roughly 10 years now. Previously, Kevin owned his own business and acted as a registered investment advisor, specializing in energy. He was also a freelance oil analyst for Orient Trading Co., a commodity futures trading firm in Japan. Kevin is currently a freelance writer.
PRINT THIS ARTICLE
HEAD & SHOULDERS
A Head And Shoulders Top For May Crude Oil?
04/05/04 09:53:58 AMby Kevin Hopson
May crude oil has been hitting new highs in recent months but the head and shoulders breakdown could indicate a correction in the near-term.
Position: N/A
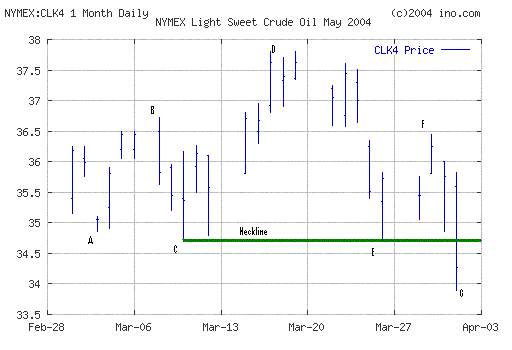
| Crude oil prices have continued to move higher the last several months, with the current front-month (May) futures contract recently hitting an all-time high of $37.80. However, the May contract appears to have broken to the downside from a head and shoulders formation, which could signal a significant correction in the near-term. Because head and shoulders formations tend to develop during market tops, a break of the neckline usually indicates further weakness. |
| If you look at the one-month chart, you can make out this pattern. Points A-B-C represent the left shoulder, points C-D-E represent the head, and points E-F-G represent the right shoulder. Once the left shoulder and head have formed, draw a trendline from point C to point F, to create the neckline. You want to watch this support line as the right shoulder nears completion. Sometimes prices will bounce off the neckline and actually use the head and shoulders formation as a continuation pattern. However, more often than not, the neckline is broken and lower prices prevail. |

|
| Figure 1: One month daily chart of Crude Oil futures. |
| Graphic provided by: Ino.com. |
| |
| Looking at the one-month chart, May crude oil broke below the neckline ($34.70), meaning further weakness is likely in the near-term. But how low will prices go? Well, taking the distance from point C to point D - the length of the head - you come up with $3.10 ($37.80-$34.70). If you subtract this number from the broken support level ($34.70), you come up with $31.60 ($34.70-$3.10). So, the $31.60 level is an approximate downside target for May crude oil in the near-term. |
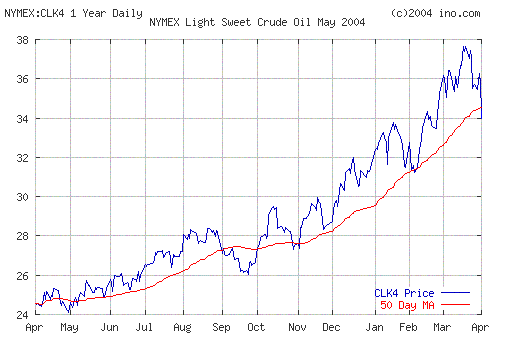
 Figure 2: One-year chart of Crude Oil. Also notice that the contract closed below its 50-day moving average ($34.48) after breaking support along the neckline, as illustrated in the one-year chart. Since the 50-day moving average has acted as ultimate support for prices on several occasions over the past year, the recent breach of support here adds to the short-term bearishness. As a result, I would remain cautious on crude oil prices in the near-term. |
Kevin has been a technical analyst for roughly 10 years now. Previously, Kevin owned his own business and acted as a registered investment advisor, specializing in energy. He was also a freelance oil analyst for Orient Trading Co., a commodity futures trading firm in Japan. Kevin is currently a freelance writer.
| Glen Allen, VA | |
| E-mail address: | hopson_1@yahoo.com |
Click here for more information about our publications!
Comments
Date: 04/06/04Rank: 5Comment:

Request Information From Our Sponsors
- StockCharts.com, Inc.
- Candle Patterns
- Candlestick Charting Explained
- Intermarket Technical Analysis
- John Murphy on Chart Analysis
- John Murphy's Chart Pattern Recognition
- John Murphy's Market Message
- MurphyExplainsMarketAnalysis-Intermarket Analysis
- MurphyExplainsMarketAnalysis-Visual Analysis
- StockCharts.com
- Technical Analysis of the Financial Markets
- The Visual Investor
- VectorVest, Inc.
- Executive Premier Workshop
- One-Day Options Course
- OptionsPro
- Retirement Income Workshop
- Sure-Fire Trading Systems (VectorVest, Inc.)
- Trading as a Business Workshop
- VectorVest 7 EOD
- VectorVest 7 RealTime/IntraDay
- VectorVest AutoTester
- VectorVest Educational Services
- VectorVest OnLine
- VectorVest Options Analyzer
- VectorVest ProGraphics v6.0
- VectorVest ProTrader 7
- VectorVest RealTime Derby Tool
- VectorVest Simulator
- VectorVest Variator
- VectorVest Watchdog
