HOT TOPICS LIST
- MACD
- Fibonacci
- RSI
- Gann
- ADXR
- Stochastics
- Volume
- Triangles
- Futures
- Cycles
- Volatility
- ZIGZAG
- MESA
- Retracement
- Aroon
INDICATORS LIST
LIST OF TOPICS
PRINT THIS ARTICLE
by Han Kim
As a novice trader, I'm looking for a simple, straightforward indicator to help me make trading decisions. The RSI is just that- simple and straightforward. Here's how I use the RSI to stay on the safer side of the price movement.
Position: Sell
Han Kim
Traders.com Advantage Staff Writer
PRINT THIS ARTICLE
RSI
Trading The Upper Half Of The RSI
05/08/00 03:01:09 PMby Han Kim
As a novice trader, I'm looking for a simple, straightforward indicator to help me make trading decisions. The RSI is just that- simple and straightforward. Here's how I use the RSI to stay on the safer side of the price movement.
Position: Sell
| The concept of making trading decisions with the Relative Strength Index (RSI) is simple and very sound. It works by using a look-back of a set amount of days to see how well the security has performed. The up closes are averaged with the down closes for the same period, and converted to a ratio with a value between 1 and 100. With 50 being neutral, anything above 50 is positive momentum, and anything under 50 is negative. This information is then used as an indication of the next day's price movement. Created by J. Welles Wilder, the formula for the RSI is: RS = {(average of UC for X days)/(average of DC for X days)} RSI = 100 - {100/(1+RS)} X = The number of look-back periods used in the calculation UC = The actual price change on up closes DC = The actual price change on down closes |
| The formula itself can be adjusted to your desired sensitivity of price action. The lower the value (the fewer days used) of the look-back period, the greater the sensitivity (more noise) and vice versa. The most common value for look-back period is 14 days. I'll use this to evaluate Cisco Corporation (CSCO). |

|
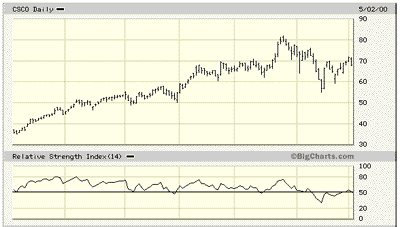
| Six month chart for CSCO with daily OHLC and RSI(14). |
| Graphic provided by: Screen capture from Bigcharts.com. |
| |
| In the graph above, you can see where the RSI crosses the 50 line. This is my trade signal. When the RSI crosses downward, below 50, it's a sell. When the RSI crosses upward, through 50, it's a buy. Essentially, the 50 line indicates the break-even point for the price movement in the last 14 trading days (neglecting all other expenses). While the RSI is above 50, the average change in price of CSCO is on the positive side. As long as my average winnings for last 14 days are greater than the average losses for that same period, I hold onto my shares. Looking back at the last 14 trading days and the direction of the price movement in the more recent days, you can get a sense of the price's momentum. |
| Trading the upper half of the RSI is great when prices trend. It's a simple yet powerful indicator to use. As of May 3, 2000, CSCO is a sell. |
Traders.com Advantage Staff Writer
| Title: | Webmaster |
| Company: | Technical Analysis, Inc. |
| Address: | 4757 California AVE SW |
| Seattle, WA 98116 | |
| Phone # for sales: | 206-938-0570 |
| Fax: | 206-938-1307 |
| Website: | www.traders.com |
| E-mail address: | hkim@traders.com |
Traders' Resource Links | |
| Charting the Stock Market: The Wyckoff Method -- Books | |
| Working-Money.com -- Online Trading Services | |
| Traders.com Advantage -- Online Trading Services | |
| Technical Analysis of Stocks & Commodities -- Publications and Newsletters | |
| Working Money, at Working-Money.com -- Publications and Newsletters | |
| Traders.com Advantage -- Publications and Newsletters | |
| Professional Traders Starter Kit -- Software | |
Click here for more information about our publications!
Comments
Date: / /Rank: 4Comment:
Date: / /Rank: Comment: In this example the RSI was at the same level a couple of month before and did not collapse like it has on the next RSI level.
Maybe Han kim should use an uptrend trendline and show how what used to be support becomes resistance once the trend has been penetratyed probably with high volum.
I am a little surprised to see how lightly this subject is treated.
Date: 03/02/01Rank: 3Comment:

Request Information From Our Sponsors
- StockCharts.com, Inc.
- Candle Patterns
- Candlestick Charting Explained
- Intermarket Technical Analysis
- John Murphy on Chart Analysis
- John Murphy's Chart Pattern Recognition
- John Murphy's Market Message
- MurphyExplainsMarketAnalysis-Intermarket Analysis
- MurphyExplainsMarketAnalysis-Visual Analysis
- StockCharts.com
- Technical Analysis of the Financial Markets
- The Visual Investor
- VectorVest, Inc.
- Executive Premier Workshop
- One-Day Options Course
- OptionsPro
- Retirement Income Workshop
- Sure-Fire Trading Systems (VectorVest, Inc.)
- Trading as a Business Workshop
- VectorVest 7 EOD
- VectorVest 7 RealTime/IntraDay
- VectorVest AutoTester
- VectorVest Educational Services
- VectorVest OnLine
- VectorVest Options Analyzer
- VectorVest ProGraphics v6.0
- VectorVest ProTrader 7
- VectorVest RealTime Derby Tool
- VectorVest Simulator
- VectorVest Variator
- VectorVest Watchdog
