HOT TOPICS LIST
- MACD
- Fibonacci
- RSI
- Gann
- ADXR
- Stochastics
- Volume
- Triangles
- Futures
- Cycles
- Volatility
- ZIGZAG
- MESA
- Retracement
- Aroon
INDICATORS LIST
LIST OF TOPICS
PRINT THIS ARTICLE
by Kevin Hopson
Despite closing above their 10-day and 20-day moving averages, the Dow and S&P 500 have to take out further resistance if their short-term trends are going to reverse.
Position: Hold
Kevin Hopson
Kevin has been a technical analyst for roughly 10 years now. Previously, Kevin owned his own business and acted as a registered investment advisor, specializing in energy. He was also a freelance oil analyst for Orient Trading Co., a commodity futures trading firm in Japan. Kevin is currently a freelance writer.
PRINT THIS ARTICLE
TECHNICAL ANALYSIS
Dow And S&P 500 Find Themselves In The Same Boat
03/31/04 09:38:39 AMby Kevin Hopson
Despite closing above their 10-day and 20-day moving averages, the Dow and S&P 500 have to take out further resistance if their short-term trends are going to reverse.
Position: Hold
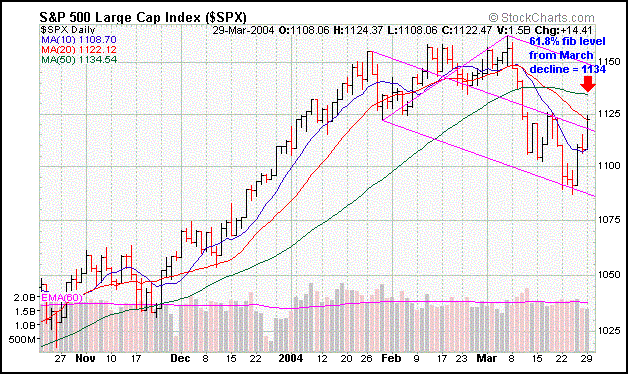
| I touched on the S&P 500 (SPX) just over a week ago, citing the 1,090 level as a potential reversal point for the index. As you can see on the chart, the index bounced off this support level last week and has proceeded to move higher. Because the SPX has now closed above its 10-day and 20-day moving averages, there is a good chance that a short-term bottom has been established. However, the index has a major hurdle to overcome if the longer-term picture is going to turn bullish again. |
| For example, notice that the SPX is coming up on its 50-day moving average (1,134.54). This moving average had acted as ultimate support for the index since March 2003. As a result, the recent break below the 50-day moving average will likely turn this price level into resistance, and the 61.8 percent retracement (1,134) from the March decline comes in at this same price level. This 1,134 level should act as significant resistance for the S&P 500 in the near-term. |

|
| Graphic provided by: Stockcharts.com. |
| |
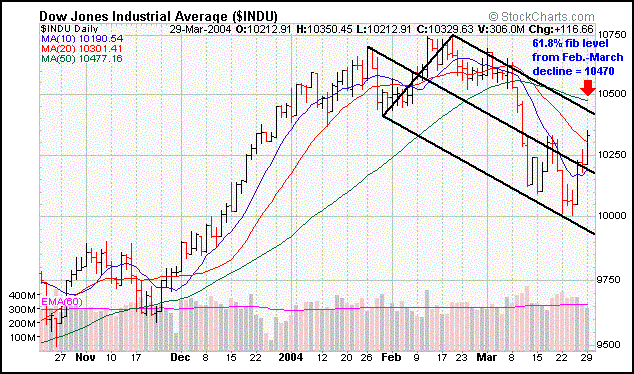
| Moving on to the Dow Jones Industrial Average (INDU), you will see that both indexes are in the same boat. The Dow is also approaching its 50-day moving average (10,477.16), while the 61.8 percent retracement level (10,470) from the February -March decline comes in right below it. As a result, the 10,470 to 10,480 range will likely act as significant resistance for the Dow in the near-term. Unless the Dow and S&P 500 can take out resistance at the 10,470-10,480 and 1,134 levels, respectively, their current downtrends will remain intact. |
 Figure 2: Down Jones Industrial Average. |
Kevin has been a technical analyst for roughly 10 years now. Previously, Kevin owned his own business and acted as a registered investment advisor, specializing in energy. He was also a freelance oil analyst for Orient Trading Co., a commodity futures trading firm in Japan. Kevin is currently a freelance writer.
| Glen Allen, VA | |
| E-mail address: | hopson_1@yahoo.com |
Click here for more information about our publications!
Comments
Date: 03/31/04Rank: 5Comment:
Date: 04/07/04Rank: 5Comment:

Request Information From Our Sponsors
- VectorVest, Inc.
- Executive Premier Workshop
- One-Day Options Course
- OptionsPro
- Retirement Income Workshop
- Sure-Fire Trading Systems (VectorVest, Inc.)
- Trading as a Business Workshop
- VectorVest 7 EOD
- VectorVest 7 RealTime/IntraDay
- VectorVest AutoTester
- VectorVest Educational Services
- VectorVest OnLine
- VectorVest Options Analyzer
- VectorVest ProGraphics v6.0
- VectorVest ProTrader 7
- VectorVest RealTime Derby Tool
- VectorVest Simulator
- VectorVest Variator
- VectorVest Watchdog
- StockCharts.com, Inc.
- Candle Patterns
- Candlestick Charting Explained
- Intermarket Technical Analysis
- John Murphy on Chart Analysis
- John Murphy's Chart Pattern Recognition
- John Murphy's Market Message
- MurphyExplainsMarketAnalysis-Intermarket Analysis
- MurphyExplainsMarketAnalysis-Visual Analysis
- StockCharts.com
- Technical Analysis of the Financial Markets
- The Visual Investor
