HOT TOPICS LIST
- MACD
- Fibonacci
- RSI
- Gann
- ADXR
- Stochastics
- Volume
- Triangles
- Futures
- Cycles
- Volatility
- ZIGZAG
- MESA
- Retracement
- Aroon
INDICATORS LIST
LIST OF TOPICS
PRINT THIS ARTICLE
by David Penn
With a minute wave "iv" low in late March, could higher prices in April be ahead?
Position: N/A
David Penn
Technical Writer for Technical Analysis of STOCKS & COMMODITIES magazine, Working-Money.com, and Traders.com Advantage.
PRINT THIS ARTICLE
ELLIOTT WAVE
Counting Off The Lows
03/31/04 09:36:55 AMby David Penn
With a minute wave "iv" low in late March, could higher prices in April be ahead?
Position: N/A
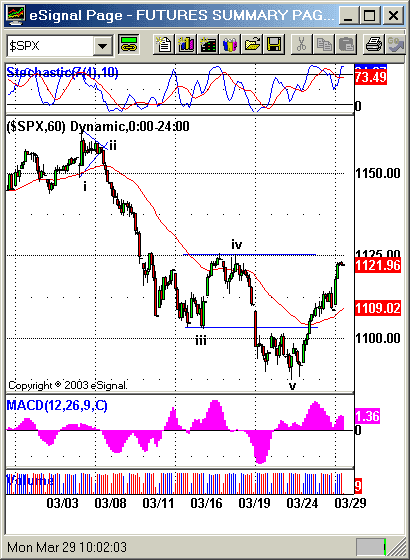
| My most recent attempt at an Elliott wave count in the S&P 500 ("The Count Right Now," Working-Money.com, March 3, 2004) posited a minute wave "iv" low in late February around 1120. This low, I believed, was the product of a triangle breakdown that heralded the end of the rally from early February ("Temporary Triangle Trouble in the Hourly S&P 500," Traders.com Advantage, March 9, 2004). As I noted in a follow-up piece, ("Stochastic Divergences, Diamonds and Elliott Waves," Traders.com Advantage, March 12, 2004), the S&P 500 fell quite a bit farther than I thought it would. In fact, prices moved far enough down to push the likely minute wave "iv" low below the level of the minuette "a" wave correction (the low of the decline that ended in early February) at 1120 to the 1090 level. |
| Thinking that the mid-March lows were THE lows, I initially saw the mid-March rally as the first leg of a five-wave sequence upward. However, when prices reversed and fell, crashing below the level of the subminuette wave "iii" low, it was clear that THE lows weren't in. Nevertheless, there seemed to be a good chance that prices would decline below the subminuette wave "iii" level by as much as they rallied above that level. This, by the way, is another application of Stan Weinstein's "swing rule," which posited a swing low of 1079.50. When prices fell as low as 1087.00, and seemed to consolidate, unable to push lower, it was a sign that the bottom, perhaps, was in. The growing positive stochastic divergences between the stochastic indicator and the price troughs in mid- to late March seemed to further underscore the case for a bottom. |

|
| Figure 1: Weinstein's swing rule suggested that prices could retreat as low as 1079.50. |
| Graphic provided by: eSignal. |
| |
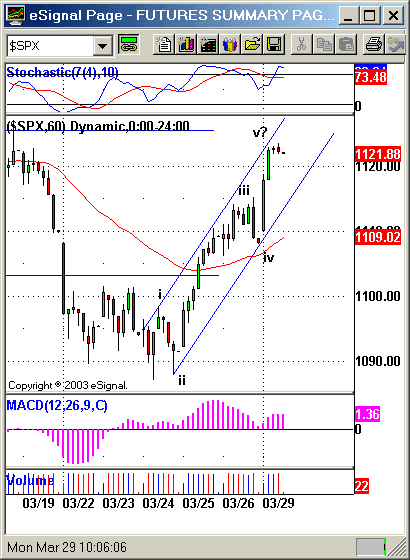
| The bottoming process ended on Thursday, March 25, as the S&P 500 soared upward virtually from the opening bell. The breadth and strength of the rally -- from early Thursday to late Friday before the sell-off -- which broke out above the 50-hour exponential moving average (EMA), has the earmarks of a third wave type rally -- though of an especially small, sub-sub minuette (supra-minuette?) degree. The advance fits well within a price channel, typical for five-wave impulsive sequences and, as counted here, has a compelling internal wave structure. When Fibonacci projections are taken of waves "i" and "iii," the first wave projects a wave five top -- or subminuette one top -- at 1118 and the third wave projects a five top at 1130. Averaging these projections together, the result is a projected wave five top at about 1124. This would suggest resistance at the level of the previous subminuette wave "iv" top during the early March decline (1125.75). |
 Figure 2. Five waves up from the bottom ... If this sequence completes near 1125, then a correction to the level of the subminuette wave "iv" low would be likely. There are additional reasons to suspect that a temporary top might develop around the 1120-1130 level. The hourly $SPX is quite extended above its 50-bar exponential average, and its stochastic is overbought and getting even more so. Already a negative (bearish) divergence has begun to develop between what are labeled in Figure 2 as the wave "iii" and wave "v?" peaks and the stochastic (price action shows higher consecutive highs, the stochastic shows lower consecutive highs). While this might resolve itself to the upside, this situation should be regarded with some caution in the immediate context. |
| Nevertheless, a wave five top of this degree would also signify a wave one top of the next higher degree (or, "subminuette") and a likely subminuette wave two correction to follow. Interestingly, such a decline would take the S&P 500 back to a test of support at the 50-hour EMA -- as well as possible support at the highs of the late March consolidation range. Should this correction take place -- and should the support at the 50-hour EMA be violated to the downside, the wave structure described here would require that the S&P 500 correct no further than 1098, the high of "sub-subminuette" wave "i" from March 24. |
Technical Writer for Technical Analysis of STOCKS & COMMODITIES magazine, Working-Money.com, and Traders.com Advantage.
| Title: | Technical Writer |
| Company: | Technical Analysis, Inc. |
| Address: | 4757 California Avenue SW |
| Seattle, WA 98116 | |
| Phone # for sales: | 206 938 0570 |
| Fax: | 206 938 1307 |
| Website: | www.Traders.com |
| E-mail address: | DPenn@traders.com |
Traders' Resource Links | |
| Charting the Stock Market: The Wyckoff Method -- Books | |
| Working-Money.com -- Online Trading Services | |
| Traders.com Advantage -- Online Trading Services | |
| Technical Analysis of Stocks & Commodities -- Publications and Newsletters | |
| Working Money, at Working-Money.com -- Publications and Newsletters | |
| Traders.com Advantage -- Publications and Newsletters | |
| Professional Traders Starter Kit -- Software | |
Click here for more information about our publications!
PRINT THIS ARTICLE

Request Information From Our Sponsors
- StockCharts.com, Inc.
- Candle Patterns
- Candlestick Charting Explained
- Intermarket Technical Analysis
- John Murphy on Chart Analysis
- John Murphy's Chart Pattern Recognition
- John Murphy's Market Message
- MurphyExplainsMarketAnalysis-Intermarket Analysis
- MurphyExplainsMarketAnalysis-Visual Analysis
- StockCharts.com
- Technical Analysis of the Financial Markets
- The Visual Investor
- VectorVest, Inc.
- Executive Premier Workshop
- One-Day Options Course
- OptionsPro
- Retirement Income Workshop
- Sure-Fire Trading Systems (VectorVest, Inc.)
- Trading as a Business Workshop
- VectorVest 7 EOD
- VectorVest 7 RealTime/IntraDay
- VectorVest AutoTester
- VectorVest Educational Services
- VectorVest OnLine
- VectorVest Options Analyzer
- VectorVest ProGraphics v6.0
- VectorVest ProTrader 7
- VectorVest RealTime Derby Tool
- VectorVest Simulator
- VectorVest Variator
- VectorVest Watchdog
