HOT TOPICS LIST
- MACD
- Fibonacci
- RSI
- Gann
- ADXR
- Stochastics
- Volume
- Triangles
- Futures
- Cycles
- Volatility
- ZIGZAG
- MESA
- Retracement
- Aroon
INDICATORS LIST
LIST OF TOPICS
PRINT THIS ARTICLE
by Ashwani Gujral
The Nikkei broke out of the 11,000 level the last week of February 2004 and held that level, moving sideways throughout the correction in the global markets. It is now breaking out from a consolidation at the 11,600 level, ahead of all other markets.
Position: N/A
Ashwani Gujral
He is founder of AGIP Securities Pvt. Ltd. which offers money management services, live chat rooms (during market hours) and independent technical analysis consultancy. The company has a big media presence from the likes of CNBC, NDTV Profit, and ZEE Business.
PRINT THIS ARTICLE
CHART ANALYSIS
The Nikkei Outperforms World Markets
04/01/04 01:31:47 PMby Ashwani Gujral
The Nikkei broke out of the 11,000 level the last week of February 2004 and held that level, moving sideways throughout the correction in the global markets. It is now breaking out from a consolidation at the 11,600 level, ahead of all other markets.
Position: N/A
| Technical strength during a correction is not only an indication that a particular market or stock will outperform in the next rally; it also means that market or stock can be used as a leading indicator for other markets or stocks ending their correction. It also points out the weakest and strongest markets or stocks. Those that show strength in a correction can be used as a scanning tool to enter outperforming instruments. These interrelationships are a manifestation of the movement of the smart money in the various markets. Smart money is the first to move at the end of a correction. And smart money is mostly contrarian money, so traders should not develop set ideas in their minds, such as "the U.S. markets will continue to rise," or "the Japanese markets will keep moving sideways." I originally wrote about the Nikkei almost three months ago ("Is it time to look at the Nikkei?" 01/08/2004). At that time the Nikkei chart was showing Japan coming back into its own as a leading economy. The fundamental news may come some time from now, but their chart is already showing the discounting nature of the markets. |

|
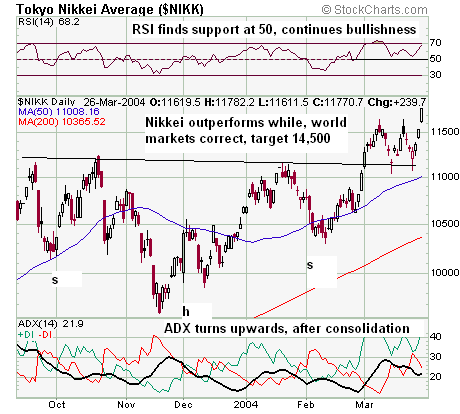
| Figure 1: Daily chart of the Nikkei. |
| Graphic provided by: eSignal.com. |
| |
| The daily Nikkei Average went into a sideways consolidation while the global markets were going through a correction, and in the last trading session (3/26/04) broke out of this sideways pattern, heading towards the head and shoulders target of 14,500. This target is calculated by measuring the depth of the head from the neckline and adding it to the neckline.(11,200 + 4300 = 14,500). The RSI found support at the 50 level during the correction -- another sign of strength. The ADX moved lower during this sideways consolidation and then turned back upwards, showing a strengthening of the trend. |
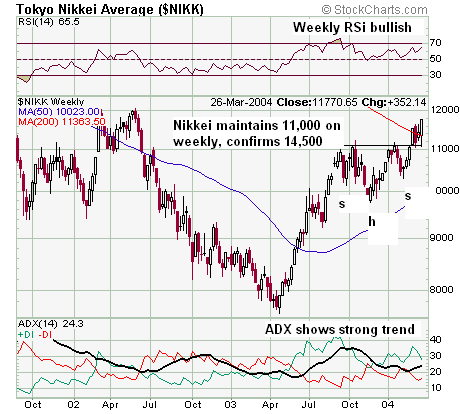
 Figure 2: Weekly chart of the Nikkei. The weekly chart of the Nikkei further confirms this view, as the Nikkei holds the 11,00 level throughout this correction. The sideways consolidation just under the 11,000 level will provide immense support on any correction and the weekly trend will remain strong as long as the Nikkei does not drop below 10,500 (the right shoulder of the consolidation pattern). The weekly RSI continues to find support at the 50 level and remains in the bullish zone. The ADX meanwhile corrected towards the 20 level and then rose, showing a continued uptrend. The weekly chart confirms the 14,500 target as the head and shoulders consolidation can be assumed to have occurred in the middle of the move. |
He is founder of AGIP Securities Pvt. Ltd. which offers money management services, live chat rooms (during market hours) and independent technical analysis consultancy. The company has a big media presence from the likes of CNBC, NDTV Profit, and ZEE Business.
| Title: | Chief mkt strategist |
| Company: | AGIP Securities |
| India | |
| Phone # for sales: | 9871066337 |
| Website: | www.ashwanigujral.com |
| E-mail address: | contact@ashwanigujral.com |
Traders' Resource Links | |
| AGIP Securities has not added any product or service information to TRADERS' RESOURCE. | |
Click here for more information about our publications!
PRINT THIS ARTICLE

Request Information From Our Sponsors
- StockCharts.com, Inc.
- Candle Patterns
- Candlestick Charting Explained
- Intermarket Technical Analysis
- John Murphy on Chart Analysis
- John Murphy's Chart Pattern Recognition
- John Murphy's Market Message
- MurphyExplainsMarketAnalysis-Intermarket Analysis
- MurphyExplainsMarketAnalysis-Visual Analysis
- StockCharts.com
- Technical Analysis of the Financial Markets
- The Visual Investor
- VectorVest, Inc.
- Executive Premier Workshop
- One-Day Options Course
- OptionsPro
- Retirement Income Workshop
- Sure-Fire Trading Systems (VectorVest, Inc.)
- Trading as a Business Workshop
- VectorVest 7 EOD
- VectorVest 7 RealTime/IntraDay
- VectorVest AutoTester
- VectorVest Educational Services
- VectorVest OnLine
- VectorVest Options Analyzer
- VectorVest ProGraphics v6.0
- VectorVest ProTrader 7
- VectorVest RealTime Derby Tool
- VectorVest Simulator
- VectorVest Variator
- VectorVest Watchdog
