

HOT TOPICS LIST
- MACD
- Fibonacci
- RSI
- Gann
- ADXR
- Stochastics
- Volume
- Triangles
- Futures
- Cycles
- Volatility
- ZIGZAG
- MESA
- Retracement
- Aroon
INDICATORS LIST
LIST OF TOPICS
PRINT THIS ARTICLE
by Ashwani Gujral
Bullish wedges are corrections in an upmove. Often the price of a stock in such a correction will retrace to a major support level. From there a resumption of the uptrend may be expected. Ford has made one such bullish wedge, correcting to major support at $12. This, along with divergences in the indicators, means Ford may be setting up to be a good medium-term buy.
Position: N/A
Ashwani Gujral
He is founder of AGIP Securities Pvt. Ltd. which offers money management services, live chat rooms (during market hours) and independent technical analysis consultancy. The company has a big media presence from the likes of CNBC, NDTV Profit, and ZEE Business.
PRINT THIS ARTICLE
WEDGE FORMATIONS
Ready To Rally? Ford Forms A Bullish Wedge
04/02/04 10:32:04 AMby Ashwani Gujral
Bullish wedges are corrections in an upmove. Often the price of a stock in such a correction will retrace to a major support level. From there a resumption of the uptrend may be expected. Ford has made one such bullish wedge, correcting to major support at $12. This, along with divergences in the indicators, means Ford may be setting up to be a good medium-term buy.
Position: N/A
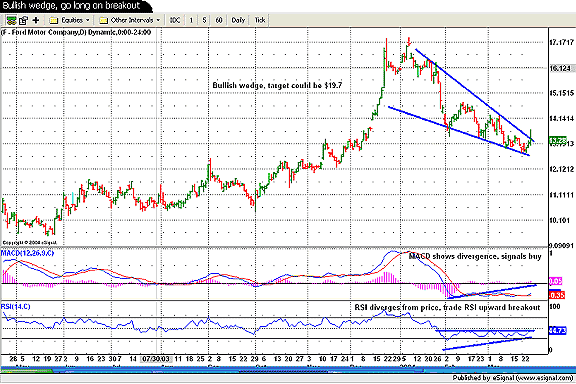
| A bullish wedge generally forms in the middle of a trend, although it can also occur at the end of a trend. If it forms as a countertrend move in an ongoing uptrend, it sets up a great opportunity to enter the trend. As the wedge ends, the daily price range becomes much smaller than the average true range. The wedge then breaks in the opposite direction and continues with the main trend. The target for the wedge is often equal to the move before the wedge added to the breakout level. There needs to be other factors to confirm the wedge pattern. For example, a divergence in the indicators with the price, or the price correcting to a major support/resistance level. The actual confirmation comes only with the movement in price. |
|
| Figure 1: Daily chart of Ford Motors. |
| Graphic provided by: eSignal.com. |
| |
| The daily chart of Ford (F) is showing a bullish wedge. It is safe to assume that this is a correction to the prior upmove. This wedge has almost retraced to major support at $12. This correction is a great opportunity to enter the stock. That Ford is correcting and not entering a downmove is indicated by the divergence shown by the MACD histogram and the daily RSI with the price. A MACD divergence with price is one of the strongest signals in technical analysis and generally leads to strong moves. A sustained breakout over $13 could see the stock headed to the $19 area, assuming the wedge has occurred in the middle of the move. |
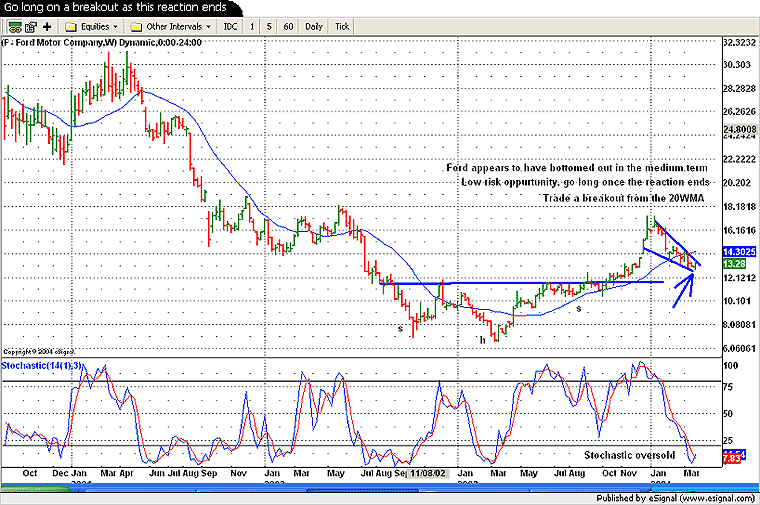 Figure 2: Weekly chart of Ford. The weekly chart of Ford shows a head and shoulders bottom formation with a breakout to the upside. After this breakout, Ford has corrected almost to the neckline at about $12. The stochastics on a weekly basis show a definite oversold level in the medium-term. Thus it is setting up a low risk buy on a weekly basis, and a price breakout from a significant support should lead to a resumption of the upmove. The stop here can be at $12 and the target is almost $19, so this trade has a favorable risk/reward ratio. But, as with all discretionary trades, it also depends on the market improving and on an actual price breakout. Generally, buying on reaction is a more profitable strategy than buying on breakouts of highs and lows. Most price breakouts of highs and lows are false and often lead to sharp moves in the opposite direction. Traders deciding to practicing this kind of trading can dramatically improve their number of profitable trades. |
He is founder of AGIP Securities Pvt. Ltd. which offers money management services, live chat rooms (during market hours) and independent technical analysis consultancy. The company has a big media presence from the likes of CNBC, NDTV Profit, and ZEE Business.
| Title: | Chief mkt strategist |
| Company: | AGIP Securities |
| India | |
| Phone # for sales: | 9871066337 |
| Website: | www.ashwanigujral.com |
| E-mail address: | contact@ashwanigujral.com |
Traders' Resource Links | |
| AGIP Securities has not added any product or service information to TRADERS' RESOURCE. | |
Click here for more information about our publications!
PRINT THIS ARTICLE

Request Information From Our Sponsors
- VectorVest, Inc.
- Executive Premier Workshop
- One-Day Options Course
- OptionsPro
- Retirement Income Workshop
- Sure-Fire Trading Systems (VectorVest, Inc.)
- Trading as a Business Workshop
- VectorVest 7 EOD
- VectorVest 7 RealTime/IntraDay
- VectorVest AutoTester
- VectorVest Educational Services
- VectorVest OnLine
- VectorVest Options Analyzer
- VectorVest ProGraphics v6.0
- VectorVest ProTrader 7
- VectorVest RealTime Derby Tool
- VectorVest Simulator
- VectorVest Variator
- VectorVest Watchdog
- StockCharts.com, Inc.
- Candle Patterns
- Candlestick Charting Explained
- Intermarket Technical Analysis
- John Murphy on Chart Analysis
- John Murphy's Chart Pattern Recognition
- John Murphy's Market Message
- MurphyExplainsMarketAnalysis-Intermarket Analysis
- MurphyExplainsMarketAnalysis-Visual Analysis
- StockCharts.com
- Technical Analysis of the Financial Markets
- The Visual Investor