HOT TOPICS LIST
- MACD
- Fibonacci
- RSI
- Gann
- ADXR
- Stochastics
- Volume
- Triangles
- Futures
- Cycles
- Volatility
- ZIGZAG
- MESA
- Retracement
- Aroon
INDICATORS LIST
LIST OF TOPICS
PRINT THIS ARTICLE
by Ashwani Gujral
Strong stocks tend to correct in sideways channels. Divergence in the MACD histogram and the stock price are a signal that the consolidation may be ending and the next move is likely to be a continuation move.
Position: Buy
Ashwani Gujral
He is founder of AGIP Securities Pvt. Ltd. which offers money management services, live chat rooms (during market hours) and independent technical analysis consultancy. The company has a big media presence from the likes of CNBC, NDTV Profit, and ZEE Business.
PRINT THIS ARTICLE
MACD
Dell Corrects In A Downward Channel
04/02/04 10:35:39 AMby Ashwani Gujral
Strong stocks tend to correct in sideways channels. Divergence in the MACD histogram and the stock price are a signal that the consolidation may be ending and the next move is likely to be a continuation move.
Position: Buy
| "Divergences between MACD and prices identify major turning points. These signals occur rarely, but when they do occur, they often let you catch major reversals and the beginning of new trends. When the prices are at new lows, but the indicator is tracing a higher bottom, it shows that the bears are exhausted and bulls are ready to gain the upper hand," says Dr. Alexander Elder in his landmark book Trading for a Living. But traders need to remember that divergences take a long time to work out so the actual buy or sell comes only with the price breakout and because of the divergence in the indicators. Divergence in the MACD histogram with price shows exhausted bulls or bears. The MACD, moving average convergence/divergence, is made up of two exponential moving averages. In an uptrend, the faster moving average is above the lower, and when the slower average crosses above the faster one, the uptrend is reversing. In a downtrend, the opposite occurs, and the slower moving average is above the faster. When they cross, the downtrend is reversing. The MACD histogram, then, shows the distance between the two exponential moving averages, with zero being neutral. When the histogram is below zero, the stock is in a downtrend and the longer the bars, the steeper the trend. The MACD histogram remains one of the strongest signals in technical analysis and once a price breakout occurs, it gives a strong buy or sell signal. |

|
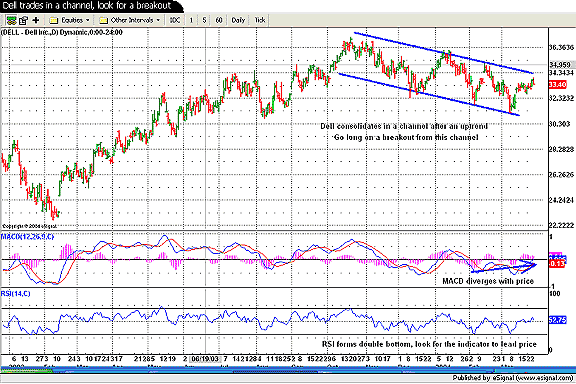
| Figure 1: Daily chart of Dell computers. |
| Graphic provided by: eSignal. |
| |
| On the Dell daily chart, we can see that Dell was in an uptrend and then went into a downward sloping channel, correcting part of the previous move. Now as we always expect the previous trend will continue after a correction, buying on reaction is a low risk swing trading strategy. Now the correction seems to be coming to an end, with signals like the divergence in the MACD with the price. The chart shows the MACD making higher lows and the price making lower lows. The other evidence is that the daily RSI made a double bottom and then broke out of the 50 level. The target for the move on breakout should be $44, as it is assumed that corrections take place in the middle of a move. |
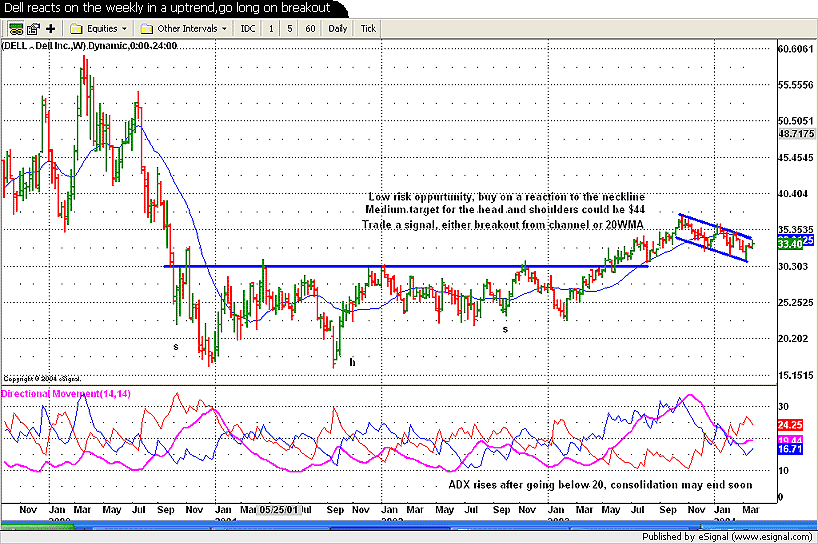
 Figure 2: Weekly chart of Dell. On the weekly chart, the picture is complete. The price, after having broken out of a 3-year head and shoulder bottom, broke out and then corrected to almost the neckline. This offers a low risk buy at the long-term weekly support of $30. A trendline breakout of the price on a weekly basis will give the actual buy signal, the stop being $30. The weekly ADX, which was indicating consolidation, went under 30 and turned up, indicating a resumption of the uptrend. Swing traders should wait for corrections in ongoing trends and should go long on long-term support, and short on long-term resistance, as they have very low risk. This, to a large extent, keeps traders from being stopped by whipsaws, the latter playing so large a part in momentum trading. |
He is founder of AGIP Securities Pvt. Ltd. which offers money management services, live chat rooms (during market hours) and independent technical analysis consultancy. The company has a big media presence from the likes of CNBC, NDTV Profit, and ZEE Business.
| Title: | Chief mkt strategist |
| Company: | AGIP Securities |
| India | |
| Phone # for sales: | 9871066337 |
| Website: | www.ashwanigujral.com |
| E-mail address: | contact@ashwanigujral.com |
Traders' Resource Links | |
| AGIP Securities has not added any product or service information to TRADERS' RESOURCE. | |
Click here for more information about our publications!
Comments
Date: 04/06/04Rank: 4Comment:
Date: 04/07/04Rank: 5Comment:

Request Information From Our Sponsors
- StockCharts.com, Inc.
- Candle Patterns
- Candlestick Charting Explained
- Intermarket Technical Analysis
- John Murphy on Chart Analysis
- John Murphy's Chart Pattern Recognition
- John Murphy's Market Message
- MurphyExplainsMarketAnalysis-Intermarket Analysis
- MurphyExplainsMarketAnalysis-Visual Analysis
- StockCharts.com
- Technical Analysis of the Financial Markets
- The Visual Investor
- VectorVest, Inc.
- Executive Premier Workshop
- One-Day Options Course
- OptionsPro
- Retirement Income Workshop
- Sure-Fire Trading Systems (VectorVest, Inc.)
- Trading as a Business Workshop
- VectorVest 7 EOD
- VectorVest 7 RealTime/IntraDay
- VectorVest AutoTester
- VectorVest Educational Services
- VectorVest OnLine
- VectorVest Options Analyzer
- VectorVest ProGraphics v6.0
- VectorVest ProTrader 7
- VectorVest RealTime Derby Tool
- VectorVest Simulator
- VectorVest Variator
- VectorVest Watchdog
