HOT TOPICS LIST
- MACD
- Fibonacci
- RSI
- Gann
- ADXR
- Stochastics
- Volume
- Triangles
- Futures
- Cycles
- Volatility
- ZIGZAG
- MESA
- Retracement
- Aroon
INDICATORS LIST
LIST OF TOPICS
PRINT THIS ARTICLE
by Gary Grosschadl
This leading worldwide designer and manufacturer of material handling products has had a deeper correction than the overall markets and now appears ready to rebound.
Position: Buy
Gary Grosschadl
Independent Canadian equities trader and technical analyst based in Peterborough
Ontario, Canada.
PRINT THIS ARTICLE
DESCENDING TRIANGLES
Columbus McKinnon (CMCO) May Be Ready To Bounce
03/29/04 10:49:05 AMby Gary Grosschadl
This leading worldwide designer and manufacturer of material handling products has had a deeper correction than the overall markets and now appears ready to rebound.
Position: Buy
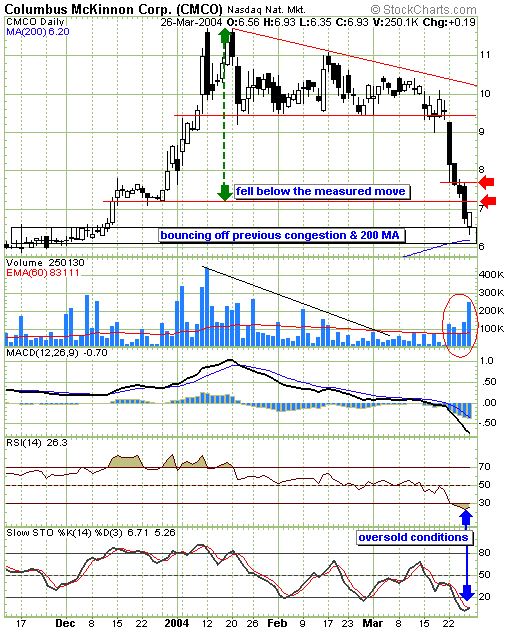
| This stock is a bit of a light trader (on average) but its volume characteristic has been true to the pattern displayed. This daily chart shows how the stock dramatically broke out of its previous descending triangle. A descending triangle is often considered a bearish formation and in this case it certainly was. The volume characteristic was correct, in that volume declined during the triangle formation until the breakdown occurred. The drop occurred on higher than average volume and Friday's action had a relative volume spike as traders were sensing a bounce opportunity. |
| Traders have three reasons to expect a bounce soon. The stock has already corrected below the measured decline for this pattern (the widest distance of the triangle applied to the downside break). Second, support came in at a previous congestion zone in the form of a previous channel and third, the bounce came very close to the 200-day moving average. The higher volume and the bullish close on Friday shows buyers were willing to support the stock from this level. |

|
| CMCO's daily chart suggests a bounce in effect. |
| Graphic provided by: Stockcharts.com. |
| |
| Two indicators also support the notion of a bounce. Both the RSI (relative strength index) and the stochastics show a very oversold level and are upticking. The two red arrows show where immediate resistance lies. Mid-candle resistance lines up with a previous support line (previous support often becomes future resistance) and the top of a previous large candlestick often represents a resistance level. Short-term traders may target the $7.20 and $7.70 areas. A spike to $8.00 should also not be ruled out. An aggressive move above these levels could occur but a consolidation in this area may be more likely. Less aggressive traders may want to wait for the outcome of the next consolidation to plan their trade. |
Independent Canadian equities trader and technical analyst based in Peterborough
Ontario, Canada.
| Website: | www.whatsonsale.ca/financial.html |
| E-mail address: | gwg7@sympatico.ca |
Click here for more information about our publications!
PRINT THIS ARTICLE

Request Information From Our Sponsors
- StockCharts.com, Inc.
- Candle Patterns
- Candlestick Charting Explained
- Intermarket Technical Analysis
- John Murphy on Chart Analysis
- John Murphy's Chart Pattern Recognition
- John Murphy's Market Message
- MurphyExplainsMarketAnalysis-Intermarket Analysis
- MurphyExplainsMarketAnalysis-Visual Analysis
- StockCharts.com
- Technical Analysis of the Financial Markets
- The Visual Investor
- VectorVest, Inc.
- Executive Premier Workshop
- One-Day Options Course
- OptionsPro
- Retirement Income Workshop
- Sure-Fire Trading Systems (VectorVest, Inc.)
- Trading as a Business Workshop
- VectorVest 7 EOD
- VectorVest 7 RealTime/IntraDay
- VectorVest AutoTester
- VectorVest Educational Services
- VectorVest OnLine
- VectorVest Options Analyzer
- VectorVest ProGraphics v6.0
- VectorVest ProTrader 7
- VectorVest RealTime Derby Tool
- VectorVest Simulator
- VectorVest Variator
- VectorVest Watchdog
