HOT TOPICS LIST
- MACD
- Fibonacci
- RSI
- Gann
- ADXR
- Stochastics
- Volume
- Triangles
- Futures
- Cycles
- Volatility
- ZIGZAG
- MESA
- Retracement
- Aroon
INDICATORS LIST
LIST OF TOPICS
PRINT THIS ARTICLE
by Kevin Hopson
The Lehman Treasury Bond Fund has ignored typical bearish patterns on the chart by continuing to move higher. However, there are some key price levels to watch in determining which direction the fund will move next.
Position: Hold
Kevin Hopson
Kevin has been a technical analyst for roughly 10 years now. Previously, Kevin owned his own business and acted as a registered investment advisor, specializing in energy. He was also a freelance oil analyst for Orient Trading Co., a commodity futures trading firm in Japan. Kevin is currently a freelance writer.
PRINT THIS ARTICLE
TECHNICAL ANALYSIS
What's Next For The Lehman Treasury Bond Fund?
03/30/04 10:55:06 AMby Kevin Hopson
The Lehman Treasury Bond Fund has ignored typical bearish patterns on the chart by continuing to move higher. However, there are some key price levels to watch in determining which direction the fund will move next.
Position: Hold
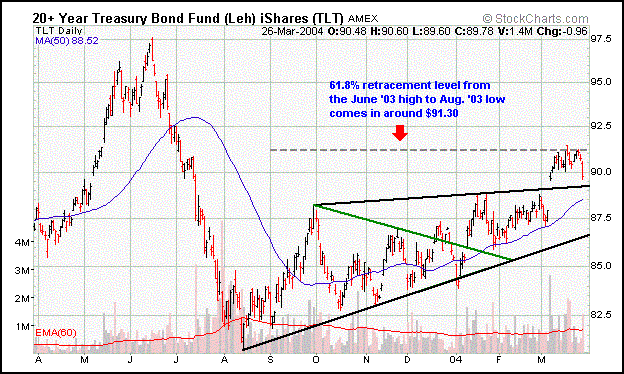
| I have touched on the Lehman 20+ Year Treasury Bond Fund iShares (TLT) several times in the past. Unfortunately, my prediction for lower bond prices and higher interest rates has failed to come to fruition. Looking at the one-year chart for TLT, you will notice that the fund formed a symmetrical triangle late last year. This is illustrated by the green downtrend line and the bottom black uptrend line. Since these types of triangles tend to act as continuation patterns and the trend was down, I expected to see a further move to the downside. |
| When this failed to occur, I thought a longer-term pattern might develop as the fund appeared to be forming a large rising wedge, illustrated by the two black trendlines. Since rising wedge formations typically break to the downside, I believed that my initial gut feeling of lower bond prices was still legitimate. However, this pattern failed as well. Now I am wondering what will happen next. |

|
| Figure 1: One-year daily chart of TLT. |
| Graphic provided by: Stockcharts.com. |
| |
| If there is any support for lower bond prices and rising interest rates, it is the 61.8 percent retracement level ($91.30) from the June '03 to Aug. '03 decline. Notice that the fund recently reversed around this price level. The 61.8 percent retracement level tends to act as the ultimate reversal point during corrections. As a result, there may have been a significant top in the fund. |
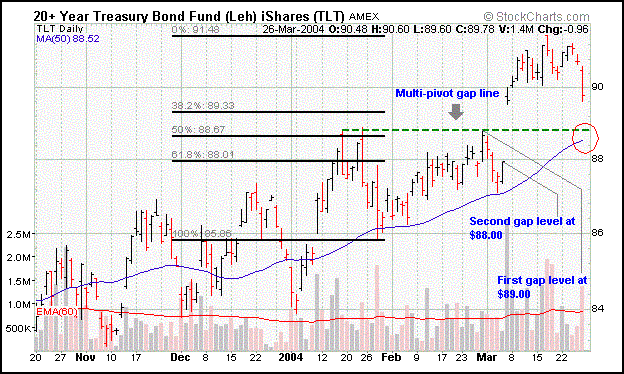
 Figure 2: Four month daily chart of TLT. However, I would not short unless key support in the $88.00 to $89.00 range is taken out. This support level is the site of March's quadruple top breakout, the 50 and 61.8 percent retracement levels from the late January to mid-March rally, and the fund's 50-day moving average. It is also the site of two unfilled gaps from March's breakout. |
| The $88.00 to $89.00 range should act as a significant bouncing point in the near-term. If this holds true and the fund eventually breaches resistance around $91.30, I would look for a further rally in bond prices (as impossible as it seems). On the other hand, a move below $88.00 would likely indicate a top in bond prices and additional weakness ahead. |
Kevin has been a technical analyst for roughly 10 years now. Previously, Kevin owned his own business and acted as a registered investment advisor, specializing in energy. He was also a freelance oil analyst for Orient Trading Co., a commodity futures trading firm in Japan. Kevin is currently a freelance writer.
| Glen Allen, VA | |
| E-mail address: | hopson_1@yahoo.com |
Click here for more information about our publications!
PRINT THIS ARTICLE

Request Information From Our Sponsors
- StockCharts.com, Inc.
- Candle Patterns
- Candlestick Charting Explained
- Intermarket Technical Analysis
- John Murphy on Chart Analysis
- John Murphy's Chart Pattern Recognition
- John Murphy's Market Message
- MurphyExplainsMarketAnalysis-Intermarket Analysis
- MurphyExplainsMarketAnalysis-Visual Analysis
- StockCharts.com
- Technical Analysis of the Financial Markets
- The Visual Investor
- VectorVest, Inc.
- Executive Premier Workshop
- One-Day Options Course
- OptionsPro
- Retirement Income Workshop
- Sure-Fire Trading Systems (VectorVest, Inc.)
- Trading as a Business Workshop
- VectorVest 7 EOD
- VectorVest 7 RealTime/IntraDay
- VectorVest AutoTester
- VectorVest Educational Services
- VectorVest OnLine
- VectorVest Options Analyzer
- VectorVest ProGraphics v6.0
- VectorVest ProTrader 7
- VectorVest RealTime Derby Tool
- VectorVest Simulator
- VectorVest Variator
- VectorVest Watchdog
