HOT TOPICS LIST
- MACD
- Fibonacci
- RSI
- Gann
- ADXR
- Stochastics
- Volume
- Triangles
- Futures
- Cycles
- Volatility
- ZIGZAG
- MESA
- Retracement
- Aroon
INDICATORS LIST
LIST OF TOPICS
PRINT THIS ARTICLE
by Gary Grosschadl
Applied Materials, Inc. (AMAT) has moved below recent support and in doing so has violated two important thresholds.
Position: Sell
Gary Grosschadl
Independent Canadian equities trader and technical analyst based in Peterborough
Ontario, Canada.
PRINT THIS ARTICLE
DESCENDING TRIANGLES
Double Trouble For Applied Materials, Inc.
03/23/04 08:16:20 AMby Gary Grosschadl
Applied Materials, Inc. (AMAT) has moved below recent support and in doing so has violated two important thresholds.
Position: Sell
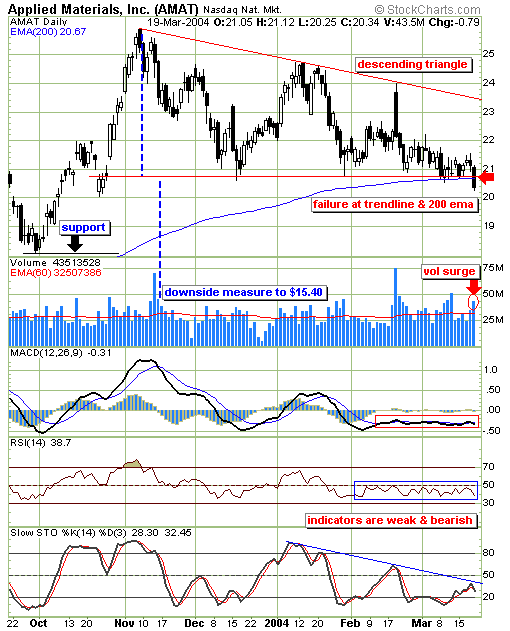
| AMAT has been weak the past two weeks but actually held up better than the Nasdaq index. Till now. Friday's bearish move below recent support came on a volume surge showing extra significance. |
| This extra significance comes in the form of violating the descending triangle and going below their 200-day EMA. Descending triangles are a bearish formation in which each successive drive to the top trendline is met with bearish forces in the form of successively lower highs. When this pattern finally fails, it is a result of bullish support crumbling at the lower trendline as volume surges higher as more traders see this weakness. |

|
| AMAT fails at crucial support on this daily chart. |
| Graphic provided by: Stockcharts.com. |
| |
| Support could come at a previous pivot point from last October near $18. Should this turn out to be temporary support, then the possibility of the pattern's measured move comes into consideration. This measured move is equal to the distance of the widest part of the descending triangle, and then applied to the downside move below the lower trendline. |
| The displayed indicators all show the stock being weak with key levels acting as overhead resistance. MACD (moving average convergence/divergence) is moving listlessly sideways under the zero level, showing weakness. The same can be said for the RSI (relative strength index), under its key 50 level. Lastly the stochastics shows its own weakness as another downleg starts below the 50 level. |
Independent Canadian equities trader and technical analyst based in Peterborough
Ontario, Canada.
| Website: | www.whatsonsale.ca/financial.html |
| E-mail address: | gwg7@sympatico.ca |
Click here for more information about our publications!
Comments

Request Information From Our Sponsors
- StockCharts.com, Inc.
- Candle Patterns
- Candlestick Charting Explained
- Intermarket Technical Analysis
- John Murphy on Chart Analysis
- John Murphy's Chart Pattern Recognition
- John Murphy's Market Message
- MurphyExplainsMarketAnalysis-Intermarket Analysis
- MurphyExplainsMarketAnalysis-Visual Analysis
- StockCharts.com
- Technical Analysis of the Financial Markets
- The Visual Investor
- VectorVest, Inc.
- Executive Premier Workshop
- One-Day Options Course
- OptionsPro
- Retirement Income Workshop
- Sure-Fire Trading Systems (VectorVest, Inc.)
- Trading as a Business Workshop
- VectorVest 7 EOD
- VectorVest 7 RealTime/IntraDay
- VectorVest AutoTester
- VectorVest Educational Services
- VectorVest OnLine
- VectorVest Options Analyzer
- VectorVest ProGraphics v6.0
- VectorVest ProTrader 7
- VectorVest RealTime Derby Tool
- VectorVest Simulator
- VectorVest Variator
- VectorVest Watchdog
