HOT TOPICS LIST
- MACD
- Fibonacci
- RSI
- Gann
- ADXR
- Stochastics
- Volume
- Triangles
- Futures
- Cycles
- Volatility
- ZIGZAG
- MESA
- Retracement
- Aroon
INDICATORS LIST
LIST OF TOPICS
PRINT THIS ARTICLE
by Gary Grosschadl
Gold successfully bounced off $390 support and now has upside resistance to tackle.
Position: Hold
Gary Grosschadl
Independent Canadian equities trader and technical analyst based in Peterborough
Ontario, Canada.
PRINT THIS ARTICLE
CHART ANALYSIS
Gold Moving Toward Overhead Resistance
03/23/04 11:09:00 AMby Gary Grosschadl
Gold successfully bounced off $390 support and now has upside resistance to tackle.
Position: Hold
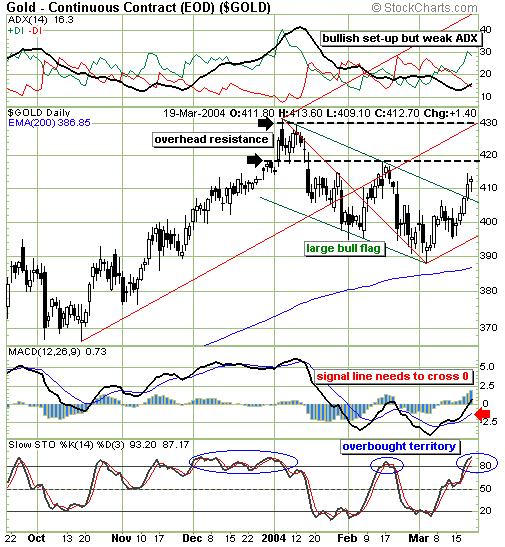
| The daily chart shows the price of gold peaking early in the year at $432 and undergoing a two month correction, knocking off $44 to hit $388. Using that $388 low, I've drawn in a red pitchfork using three major pivot points on the chart below. This bullish pointing pitchfork suggests a possible move that could challenge the median line and put the price of gold very close to its previous high. In apparent agreement with this bullish view is the 200-day EMA. Stocks, commodities, or indexes are generally deemed bullish if they are above this often-watched moving average. |
| Another bullish view can be taken from the presence of a bullish flag, shown on the chart below by the two parallel green lines. The recent move above the upper green trendline suggests a continuation move in the direction of the prior trend. Should this turn out to be a very strong bull move, both the upper pitchfork and the flag target suggest a possible move to the $465 area. The target is found by taking the difference between the high and the low ($430 - $370 = $60), and adding it to the flag breakout point ($405 + $60 + $465). This move, if it transpires, could take several months. |

|
| Daily chart for gold showing overhead resistance. |
| Graphic provided by: Stockcharts.com. |
| |
| In the interim there will likely be stiff resistance from the two areas indicated at the $418 and $430 vicinity, the $418 representing previous gap resistance and the $430 being the previous high. Some consolidation here would not be unexpected. |
| Several indicators are also worth commentary. The directional movement index at the top of the chart shows a bullish set-up but the ADX is considered weak below 20. A move past the ADX 20 level with a good upslope would be the ideal. The MACD or moving average convergence/divergence indicator shows a bullish cross, but at this stage of the recent rise the thinner signal line really needs to rise above the zero line, otherwise it could simply stall as it did the last time. The stochastics indicator is considered toppy or overbought above the 80 level. A move below the 80 level could indicate the beginning of a downleg. During strong trending conditions, stochastics can stick at higher levels as it did last December, but normally the ADX would have to be higher. Right now the trend is weak by ADX measure so a stochastic downleg could easily occur. |
| Looking ahead, should the next retracement hold at the bull flag trendline, around $405, this would be very bullish going forward. As far as the pitchfork goes, as long as the lower pitchfork line holds, the trend is still bullish. A move below that lower median line would most likely lead to a test of the 200-day EMA, this being the downside danger. |
Independent Canadian equities trader and technical analyst based in Peterborough
Ontario, Canada.
| Website: | www.whatsonsale.ca/financial.html |
| E-mail address: | gwg7@sympatico.ca |
Click here for more information about our publications!
Comments
Date: 03/23/04Rank: 3Comment:
Date: 03/24/04Rank: 3Comment:

Request Information From Our Sponsors
- StockCharts.com, Inc.
- Candle Patterns
- Candlestick Charting Explained
- Intermarket Technical Analysis
- John Murphy on Chart Analysis
- John Murphy's Chart Pattern Recognition
- John Murphy's Market Message
- MurphyExplainsMarketAnalysis-Intermarket Analysis
- MurphyExplainsMarketAnalysis-Visual Analysis
- StockCharts.com
- Technical Analysis of the Financial Markets
- The Visual Investor
- VectorVest, Inc.
- Executive Premier Workshop
- One-Day Options Course
- OptionsPro
- Retirement Income Workshop
- Sure-Fire Trading Systems (VectorVest, Inc.)
- Trading as a Business Workshop
- VectorVest 7 EOD
- VectorVest 7 RealTime/IntraDay
- VectorVest AutoTester
- VectorVest Educational Services
- VectorVest OnLine
- VectorVest Options Analyzer
- VectorVest ProGraphics v6.0
- VectorVest ProTrader 7
- VectorVest RealTime Derby Tool
- VectorVest Simulator
- VectorVest Variator
- VectorVest Watchdog
