HOT TOPICS LIST
- MACD
- Fibonacci
- RSI
- Gann
- ADXR
- Stochastics
- Volume
- Triangles
- Futures
- Cycles
- Volatility
- ZIGZAG
- MESA
- Retracement
- Aroon
INDICATORS LIST
LIST OF TOPICS
PRINT THIS ARTICLE
by Kevin Hopson
The S&P 500 Index looks to be headed lower in the near-term but when will the bleeding stop?
Position: Hold
Kevin Hopson
Kevin has been a technical analyst for roughly 10 years now. Previously, Kevin owned his own business and acted as a registered investment advisor, specializing in energy. He was also a freelance oil analyst for Orient Trading Co., a commodity futures trading firm in Japan. Kevin is currently a freelance writer.
PRINT THIS ARTICLE
TECHNICAL ANALYSIS
A Potential Downside Target For The S&P 500
03/22/04 01:35:31 PMby Kevin Hopson
The S&P 500 Index looks to be headed lower in the near-term but when will the bleeding stop?
Position: Hold
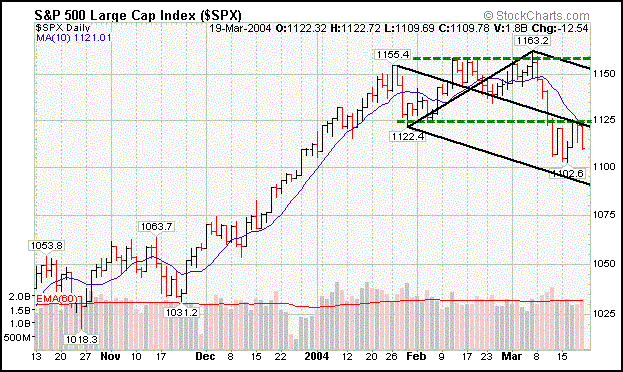
| Even though the S&P 500 Index ($SPX) rallied last Tuesday and Wednesday after an abrupt sell-off, the short-term outlook remains bearish. There are many reasons for this. First of all, the index failed to move above broken support around the 1125 level. This is the site of March's trading range breakdown, as illustrated by the green lines. It is also the site of the index's 10-day moving average, the black median line and the 38.2 percent retracement level (1125.75) from this month's decline. As a result, the path of least resistance is still down. |
| If this is true, how low will the index go before putting in a short-term bottom? Well, the trading range collapse indicates a potential downside target between 1055 and 1090. This price target was calculated by taking the number of times that prices tested the bottom channel line in alternate sequence (2), multiplying this by the width of the trading range (1160 - 1125 = 35) and subtracting this figure (35 x 2 = 70) from the top (1160 - 70 = 1090) and bottom (1125 - 70 = 1055) channel lines. |

|
| Graphic provided by: Stockcharts.com. |
| |
| In other words, the index appears to have 2 to 5 percent of additional downside in the near-term. However, there is a nice confluence of support around the 1090 level, which could act as a higher reversal point for the index. For example, not only is this the site of the bottom black parallel line, but it is also the site of the 50 percent retracement level (1090.75) from the late October '02 low to this month's high. As a result, I might look to buy on a potential pullback to this support level. Until then, staying on the sidelines is probably your best bet. |
Kevin has been a technical analyst for roughly 10 years now. Previously, Kevin owned his own business and acted as a registered investment advisor, specializing in energy. He was also a freelance oil analyst for Orient Trading Co., a commodity futures trading firm in Japan. Kevin is currently a freelance writer.
| Glen Allen, VA | |
| E-mail address: | hopson_1@yahoo.com |
Click here for more information about our publications!
Comments
Date: 03/23/04Rank: 5Comment:
Date: 03/23/04Rank: 5Comment:

Request Information From Our Sponsors
- StockCharts.com, Inc.
- Candle Patterns
- Candlestick Charting Explained
- Intermarket Technical Analysis
- John Murphy on Chart Analysis
- John Murphy's Chart Pattern Recognition
- John Murphy's Market Message
- MurphyExplainsMarketAnalysis-Intermarket Analysis
- MurphyExplainsMarketAnalysis-Visual Analysis
- StockCharts.com
- Technical Analysis of the Financial Markets
- The Visual Investor
- VectorVest, Inc.
- Executive Premier Workshop
- One-Day Options Course
- OptionsPro
- Retirement Income Workshop
- Sure-Fire Trading Systems (VectorVest, Inc.)
- Trading as a Business Workshop
- VectorVest 7 EOD
- VectorVest 7 RealTime/IntraDay
- VectorVest AutoTester
- VectorVest Educational Services
- VectorVest OnLine
- VectorVest Options Analyzer
- VectorVest ProGraphics v6.0
- VectorVest ProTrader 7
- VectorVest RealTime Derby Tool
- VectorVest Simulator
- VectorVest Variator
- VectorVest Watchdog
