HOT TOPICS LIST
- MACD
- Fibonacci
- RSI
- Gann
- ADXR
- Stochastics
- Volume
- Triangles
- Futures
- Cycles
- Volatility
- ZIGZAG
- MESA
- Retracement
- Aroon
INDICATORS LIST
LIST OF TOPICS
PRINT THIS ARTICLE
by Ashwani Gujral
Looking at their weekly chart, Crude Oil futures are ready to break out of a head and shoulder consolidation pattern. This consolidation occurred over the last four years and now seems headed towards $47.
Position: N/A
Ashwani Gujral
He is founder of AGIP Securities Pvt. Ltd. which offers money management services, live chat rooms (during market hours) and independent technical analysis consultancy. The company has a big media presence from the likes of CNBC, NDTV Profit, and ZEE Business.
PRINT THIS ARTICLE
CONSOLID FORMATION
Crude Oil Moves Slowly And Surely Upwards
03/26/04 11:01:35 AMby Ashwani Gujral
Looking at their weekly chart, Crude Oil futures are ready to break out of a head and shoulder consolidation pattern. This consolidation occurred over the last four years and now seems headed towards $47.
Position: N/A
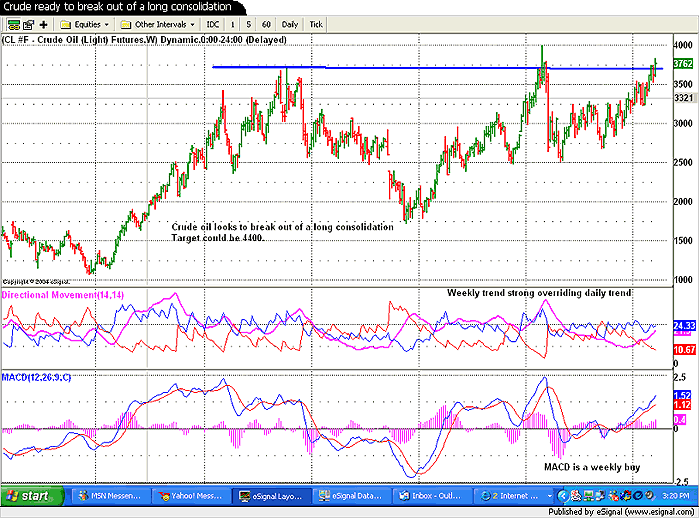
| Consolidations generally occur in the middle of trends and offer great entry opportunities as the market works through its overbought/oversold condition until it is ready to rally or decline again. A 4-year consolidation is rare but I am forced to call this a consolidation pattern as the trend before the pattern appears to be the same as that of the breakout. Such a consolidation facilitates the continuation of the trend. |

|
| Figure 1: Weekly chart of Crude oil futures. |
| Graphic provided by: eSignal.com. |
| |
| Crude continues to maintain over 3500. The weekly chart of Crude Oil futures shows a head and shoulders consolidation pattern after a sharp rally from about 1070 to 3700 and then a long consolidation in a wide range between 2500 and 3700. Crude oil now appears to be breaking out towards a final target of 4700. The target of 4700 is calculated by measuring the initial move of $27 (from $10 to $37), and adding it to the depth of the head ($17). Meanwhile, the ADX moved below 20 and then rose above it, gaining trend strength. MACD indicates a "buy" and is likely to touch new highs if it sustains above $37. |
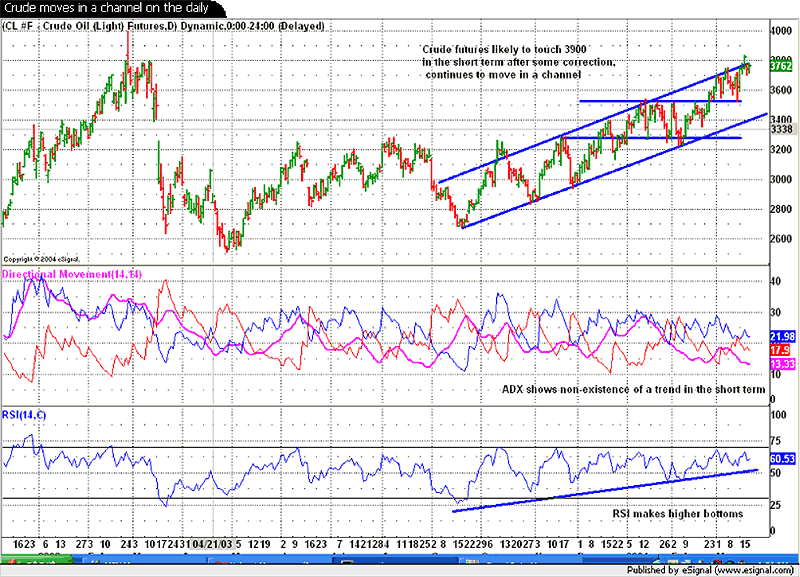
 Figure 2: Daily chart of Crude Oil futures. The daily chart shows Crude Oil futures moving in an upward channel. They recently broke upwards from a consolidation, giving them an immediate target of 3900. However a safe buy can occur at the lower trendline as crude oil is not showing any trend on the daily ADX. But the weekly ADX is strong, indicating crude oil is in an uptrend with small corrections. The daily ADX remains below 20, which shows a lack of trend strength. Meanwhile, the RSI shows higher bottoms, which are marked by the trendline and until this trendline breaks, the uptrend should be okay. |
He is founder of AGIP Securities Pvt. Ltd. which offers money management services, live chat rooms (during market hours) and independent technical analysis consultancy. The company has a big media presence from the likes of CNBC, NDTV Profit, and ZEE Business.
| Title: | Chief mkt strategist |
| Company: | AGIP Securities |
| India | |
| Phone # for sales: | 9871066337 |
| Website: | www.ashwanigujral.com |
| E-mail address: | contact@ashwanigujral.com |
Traders' Resource Links | |
| AGIP Securities has not added any product or service information to TRADERS' RESOURCE. | |
Click here for more information about our publications!
Comments
Date: 03/30/04Rank: 5Comment:

Request Information From Our Sponsors
- VectorVest, Inc.
- Executive Premier Workshop
- One-Day Options Course
- OptionsPro
- Retirement Income Workshop
- Sure-Fire Trading Systems (VectorVest, Inc.)
- Trading as a Business Workshop
- VectorVest 7 EOD
- VectorVest 7 RealTime/IntraDay
- VectorVest AutoTester
- VectorVest Educational Services
- VectorVest OnLine
- VectorVest Options Analyzer
- VectorVest ProGraphics v6.0
- VectorVest ProTrader 7
- VectorVest RealTime Derby Tool
- VectorVest Simulator
- VectorVest Variator
- VectorVest Watchdog
- StockCharts.com, Inc.
- Candle Patterns
- Candlestick Charting Explained
- Intermarket Technical Analysis
- John Murphy on Chart Analysis
- John Murphy's Chart Pattern Recognition
- John Murphy's Market Message
- MurphyExplainsMarketAnalysis-Intermarket Analysis
- MurphyExplainsMarketAnalysis-Visual Analysis
- StockCharts.com
- Technical Analysis of the Financial Markets
- The Visual Investor
