HOT TOPICS LIST
- MACD
- Fibonacci
- RSI
- Gann
- ADXR
- Stochastics
- Volume
- Triangles
- Futures
- Cycles
- Volatility
- ZIGZAG
- MESA
- Retracement
- Aroon
INDICATORS LIST
LIST OF TOPICS
PRINT THIS ARTICLE
by Ashwani Gujral
Silver is part of the precious metals sector currently in a long-term bull market. With all the uncertainity related to the equity markets and the global terror threat, it has had a vertical upmove in the past few days. Vertical upmoves are something experienced traders avoid.
Position: N/A
Ashwani Gujral
He is founder of AGIP Securities Pvt. Ltd. which offers money management services, live chat rooms (during market hours) and independent technical analysis consultancy. The company has a big media presence from the likes of CNBC, NDTV Profit, and ZEE Business.
PRINT THIS ARTICLE
CHART ANALYSIS
Are Silver Futures Overheated?
03/25/04 10:16:29 AMby Ashwani Gujral
Silver is part of the precious metals sector currently in a long-term bull market. With all the uncertainity related to the equity markets and the global terror threat, it has had a vertical upmove in the past few days. Vertical upmoves are something experienced traders avoid.
Position: N/A
| Chart analysis is as much about taking a trade as it is about not taking it. In this article, I will look at a situation where the chart seems to be too hot to enter. |
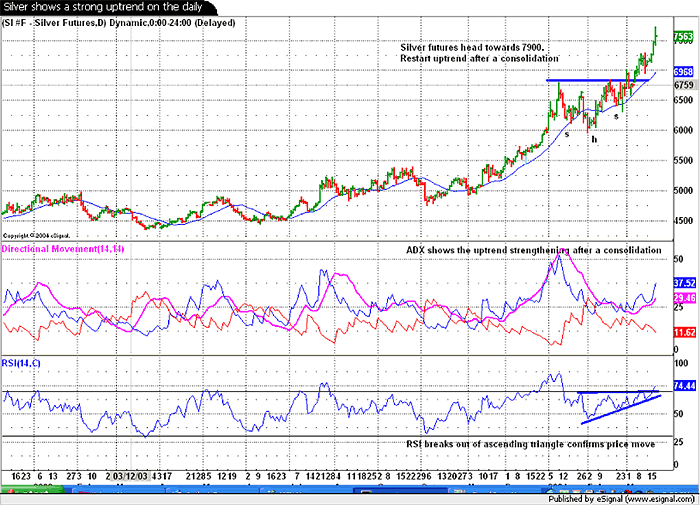
| Silver futures have broken out of a head and shoulder consolidation formation on the daily chart. Consolidation formations are often pauses in a trend that allow momentum to build again for another move in the direction of a trend. The breakouts in all the precious metals futures have occured as the equity markets started declining, clearly showing where the money was shifting. The entire precious metals sector consolidated as the equity markets headed upwards. The consolidation formations also indicated that the bull market in the sector was intact and it was only a matter of time before they started going up again. |

|
| Figure 1: Daily chart of Silver futures |
| Graphic provided by: eSignal.com. |
| |
| Silver futures now show a target of 7900, as the consolidation can be considered to have occurred in the middle of an existing trend. The daily ADX which had declined below 25, has now started moving upwards again as the upmove in Silver gains strength. We can also see the daily RSI has broken out of an ascending triangle and this confirms the breakout on the price chart. Silver offered a couple of entry opportunities as can be seen from the 20-day MA. Low risk buy trades could have been taken as Silver futures went below the 20-day MA and turned back upwards over the average. |
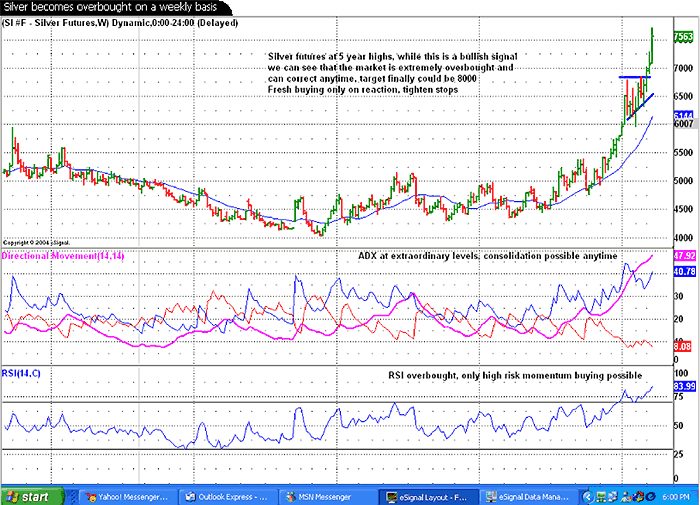
 Figure 2: Weekly chart of Silver futures. The vertical upmove is particularly worrying on the weekly chart. Investors and traders should always be cautious of vertical moves on any chart. The weekly chart only offers a very high risk momentum buying opportunity. Silver futures are trading at 5-year highs, which is bullish, but the ADX is at an extraordinarily high level of 47 and a consolidation on the weekly chart is possible at any time. Safe and low risk trading would have the trader wait for some kind of consolidation before going long on Silver futures. If this trade must be taken at all, it should be taken with close stops. The weekly chart has a target of about 8000, but the risk/reward may not be so favorable. The weekly RSI is at the extremely high level of 83. While there is no bearish indication right now, this chart does not support any buying action either. Traders should remember, momentum trading cuts both ways. |
He is founder of AGIP Securities Pvt. Ltd. which offers money management services, live chat rooms (during market hours) and independent technical analysis consultancy. The company has a big media presence from the likes of CNBC, NDTV Profit, and ZEE Business.
| Title: | Chief mkt strategist |
| Company: | AGIP Securities |
| India | |
| Phone # for sales: | 9871066337 |
| Website: | www.ashwanigujral.com |
| E-mail address: | contact@ashwanigujral.com |
Traders' Resource Links | |
| AGIP Securities has not added any product or service information to TRADERS' RESOURCE. | |
Click here for more information about our publications!
PRINT THIS ARTICLE

|

Request Information From Our Sponsors
- StockCharts.com, Inc.
- Candle Patterns
- Candlestick Charting Explained
- Intermarket Technical Analysis
- John Murphy on Chart Analysis
- John Murphy's Chart Pattern Recognition
- John Murphy's Market Message
- MurphyExplainsMarketAnalysis-Intermarket Analysis
- MurphyExplainsMarketAnalysis-Visual Analysis
- StockCharts.com
- Technical Analysis of the Financial Markets
- The Visual Investor
- VectorVest, Inc.
- Executive Premier Workshop
- One-Day Options Course
- OptionsPro
- Retirement Income Workshop
- Sure-Fire Trading Systems (VectorVest, Inc.)
- Trading as a Business Workshop
- VectorVest 7 EOD
- VectorVest 7 RealTime/IntraDay
- VectorVest AutoTester
- VectorVest Educational Services
- VectorVest OnLine
- VectorVest Options Analyzer
- VectorVest ProGraphics v6.0
- VectorVest ProTrader 7
- VectorVest RealTime Derby Tool
- VectorVest Simulator
- VectorVest Variator
- VectorVest Watchdog
