HOT TOPICS LIST
- MACD
- Fibonacci
- RSI
- Gann
- ADXR
- Stochastics
- Volume
- Triangles
- Futures
- Cycles
- Volatility
- ZIGZAG
- MESA
- Retracement
- Aroon
INDICATORS LIST
LIST OF TOPICS
PRINT THIS ARTICLE
by Ashwani Gujral
Flags are often pauses in ongoing trends. They offer a good place for traders to book profits or enter into the trends. Is gold breaking out of one such weekly flag?
Position: N/A
Ashwani Gujral
He is founder of AGIP Securities Pvt. Ltd. which offers money management services, live chat rooms (during market hours) and independent technical analysis consultancy. The company has a big media presence from the likes of CNBC, NDTV Profit, and ZEE Business.
PRINT THIS ARTICLE
FLAGS AND PENNANTS
Is Gold Restarting Its Bull Run?
03/25/04 10:13:30 AMby Ashwani Gujral
Flags are often pauses in ongoing trends. They offer a good place for traders to book profits or enter into the trends. Is gold breaking out of one such weekly flag?
Position: N/A
| Gold is always a safe haven when equity markets correct and also when the world is faced with uncertainities such as the current terrorism threat. In a previous article, I discussed a breakout in Platinum futures and predicted a breakout in both gold and silver futures as well. This seems to have occurred. Gold futures seem to have completed an intermediate downtrend on the daily chart that appeared as a bullish flag on the weekly chart. Gold has also broken out of a flag on its weekly chart and now presents an excellent entry opportunity in the long-term bull market. |

|
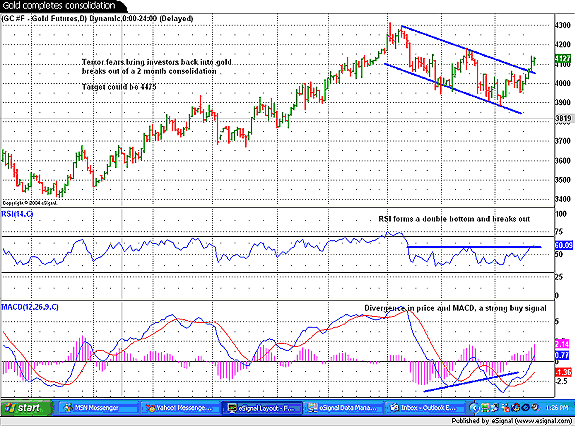
| Figure 1: Gold's daily chart. |
| Graphic provided by: eSignal.com. |
| |
| Looking at the daily chart, Gold has broken out of a downward channel. I have calculated an initial target around 4500, as this consolidation channel can be assumed to be in the middle of an upmove. The daily RSI has broken out of a double bottom pattern. The RSI can be analyzed for chart patterns in the same manner as price movements. A breakout of a bottoming pattern on the indicator adds to the confirmation of the breakout of the price chart. The MACD histogram shows a bullish divergence with the price. This is a very strong signal indicating that Gold futures are bottoming in the short-term. |
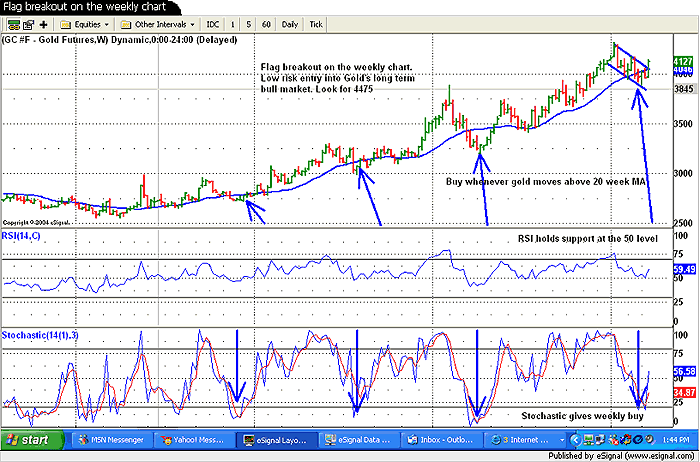
 Figure 2: Weekly chart of Gold. On the weekly chart, gold seems to have offered yet another opportunity for traders to enter in the long-term bull market. An entry set-up that is extremely useful in any time frame is the 20-period moving average. Long trades can be entered as the price goes below then back above the 20-period moving average. The weekly chart also shows a bullish flag breakout, confirming the continuation of the uptrend. The stochastic indicator can also be used to enter a trend when it reaches the oversold level and loops back above it. The weekly RSI continues to find support at the 50 level, confirming long-term strength in the Gold market. A target of 4475 can be calculated from the flag pattern on the weekly chart as well. |
| With equity markets weak and the world threatened by terrorism, Gold remains one of the best long-term trades in the current investment climate. |
He is founder of AGIP Securities Pvt. Ltd. which offers money management services, live chat rooms (during market hours) and independent technical analysis consultancy. The company has a big media presence from the likes of CNBC, NDTV Profit, and ZEE Business.
| Title: | Chief mkt strategist |
| Company: | AGIP Securities |
| India | |
| Phone # for sales: | 9871066337 |
| Website: | www.ashwanigujral.com |
| E-mail address: | contact@ashwanigujral.com |
Traders' Resource Links | |
| AGIP Securities has not added any product or service information to TRADERS' RESOURCE. | |
Click here for more information about our publications!
Comments
Date: 03/30/04Rank: 4Comment:

Request Information From Our Sponsors
- StockCharts.com, Inc.
- Candle Patterns
- Candlestick Charting Explained
- Intermarket Technical Analysis
- John Murphy on Chart Analysis
- John Murphy's Chart Pattern Recognition
- John Murphy's Market Message
- MurphyExplainsMarketAnalysis-Intermarket Analysis
- MurphyExplainsMarketAnalysis-Visual Analysis
- StockCharts.com
- Technical Analysis of the Financial Markets
- The Visual Investor
- VectorVest, Inc.
- Executive Premier Workshop
- One-Day Options Course
- OptionsPro
- Retirement Income Workshop
- Sure-Fire Trading Systems (VectorVest, Inc.)
- Trading as a Business Workshop
- VectorVest 7 EOD
- VectorVest 7 RealTime/IntraDay
- VectorVest AutoTester
- VectorVest Educational Services
- VectorVest OnLine
- VectorVest Options Analyzer
- VectorVest ProGraphics v6.0
- VectorVest ProTrader 7
- VectorVest RealTime Derby Tool
- VectorVest Simulator
- VectorVest Variator
- VectorVest Watchdog
