HOT TOPICS LIST
- MACD
- Fibonacci
- RSI
- Gann
- ADXR
- Stochastics
- Volume
- Triangles
- Futures
- Cycles
- Volatility
- ZIGZAG
- MESA
- Retracement
- Aroon
INDICATORS LIST
LIST OF TOPICS
PRINT THIS ARTICLE
by Ashwani Gujral
Corn futures have formed a rounding bottom over a period of eight years and are now breaking out. A sharp gain of 33% can be expected immediately if futures maintain over 2922.
Position: N/A
Ashwani Gujral
He is founder of AGIP Securities Pvt. Ltd. which offers money management services, live chat rooms (during market hours) and independent technical analysis consultancy. The company has a big media presence from the likes of CNBC, NDTV Profit, and ZEE Business.
PRINT THIS ARTICLE
ROUND TOP & BOTTOM
Corn Futures Looking For Another 33% Upside
03/24/04 08:53:20 AMby Ashwani Gujral
Corn futures have formed a rounding bottom over a period of eight years and are now breaking out. A sharp gain of 33% can be expected immediately if futures maintain over 2922.
Position: N/A
| Rounding bottoms form over a period of years. Ideally, this would occur in a single year, but the longer the time interval for the bottoming, the stronger the formation. During this period, investors and traders tend to overlook the particular security or market. Volumes drop very sharply. But under the surface, long-term investors accumulate, as the company or industry restructures and sheds its excesses. The breakout from the rounding bottom formation happens months before fundamental news is known by the general public. This is known as the discounting mechanism of the market. |
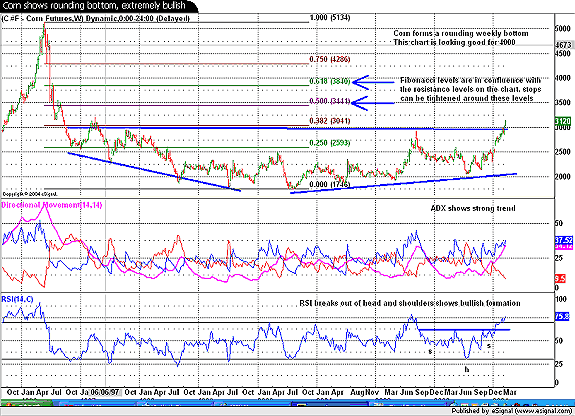
| The weekly chart of Corn (Figure 1) shows an 8-year bottoming formation that has just broken out. This is a great foundation for a strong upward rally, with the upper end of the rounding formation providing support. An approximate target for the medium-term would be 4250. This is calculated by extrapolating the width of the rounding bottom over the flat line. In addition, the important Fibonacci levels are in confluence with the resistance levels, with the next levels of resistance being at 3441 and 3840. The ADX is rising towards the 37 level, showing an extremely strong trend and the RSI shows a breakout from a head and shoulders pattern, thus providing advance confirmation of the move. Indicator breakouts generally lead price breakouts. |

|
| Figure 1: Weekly chart of Corn futures. |
| Graphic provided by: eSignal.com. |
| |
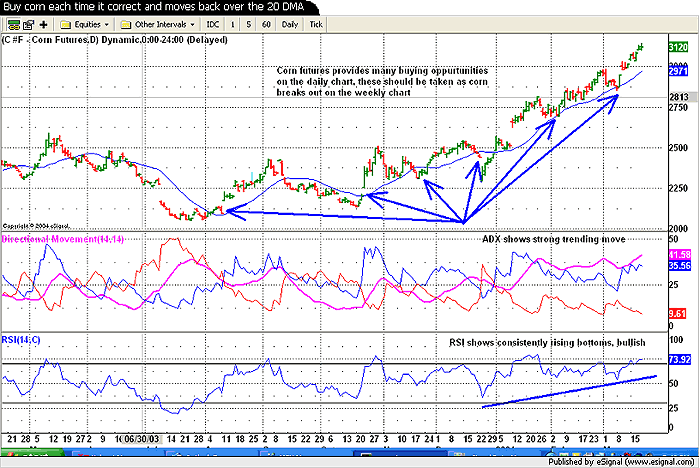
| The daily chart of Corn futures shows a strong uptrend as well. By using a 20-day MA, it is possible to enter an uptrend each time the price dips and stays below the moving average. This buying is successful so long as prices continue going up. This chart also offers a number of entry points before the weekly breakout. But with the sharpness of the expected rally, I doubt they will all materialize. These frequent corrections also point to skepticism in the rally, which only makes the rally stronger. But both the ADX and the RSI point towards a sustained uptrend. An ADX of 41 indicates good trend strength. Rising bottoms in the RSI are also an indication of continued bullishness in the Corn futures chart.  Figure 2: Daily chart of Corn futures. |
He is founder of AGIP Securities Pvt. Ltd. which offers money management services, live chat rooms (during market hours) and independent technical analysis consultancy. The company has a big media presence from the likes of CNBC, NDTV Profit, and ZEE Business.
| Title: | Chief mkt strategist |
| Company: | AGIP Securities |
| India | |
| Phone # for sales: | 9871066337 |
| Website: | www.ashwanigujral.com |
| E-mail address: | contact@ashwanigujral.com |
Traders' Resource Links | |
| AGIP Securities has not added any product or service information to TRADERS' RESOURCE. | |
Click here for more information about our publications!
Comments
Date: 03/25/04Rank: 5Comment: Can you send me your free Article with Nan Tu Sabaw, #38, Pinya hostel, University of yangon, Hle Tann, Kamayut tsp, Myanmar
Date: 03/31/04Rank: 5Comment: THANK YOU FOR YOUR CLARITY.
YOU HAVE CHOSEN TO EDUCATE,
RATHER THAN JUST TO IMPRESS.
YOU HAVE DONE BOTH.
Date: 09/05/04Rank: 5Comment:

Request Information From Our Sponsors
- StockCharts.com, Inc.
- Candle Patterns
- Candlestick Charting Explained
- Intermarket Technical Analysis
- John Murphy on Chart Analysis
- John Murphy's Chart Pattern Recognition
- John Murphy's Market Message
- MurphyExplainsMarketAnalysis-Intermarket Analysis
- MurphyExplainsMarketAnalysis-Visual Analysis
- StockCharts.com
- Technical Analysis of the Financial Markets
- The Visual Investor
- VectorVest, Inc.
- Executive Premier Workshop
- One-Day Options Course
- OptionsPro
- Retirement Income Workshop
- Sure-Fire Trading Systems (VectorVest, Inc.)
- Trading as a Business Workshop
- VectorVest 7 EOD
- VectorVest 7 RealTime/IntraDay
- VectorVest AutoTester
- VectorVest Educational Services
- VectorVest OnLine
- VectorVest Options Analyzer
- VectorVest ProGraphics v6.0
- VectorVest ProTrader 7
- VectorVest RealTime Derby Tool
- VectorVest Simulator
- VectorVest Variator
- VectorVest Watchdog
