HOT TOPICS LIST
- MACD
- Fibonacci
- RSI
- Gann
- ADXR
- Stochastics
- Volume
- Triangles
- Futures
- Cycles
- Volatility
- ZIGZAG
- MESA
- Retracement
- Aroon
INDICATORS LIST
LIST OF TOPICS
PRINT THIS ARTICLE
by Kevin Hopson
Money flow for XTO Energy has been negative recently but the trend may be ready to reverse.
Position: Accumulate
Kevin Hopson
Kevin has been a technical analyst for roughly 10 years now. Previously, Kevin owned his own business and acted as a registered investment advisor, specializing in energy. He was also a freelance oil analyst for Orient Trading Co., a commodity futures trading firm in Japan. Kevin is currently a freelance writer.
PRINT THIS ARTICLE
MONEY FLOW INDEX
A Simple Way To Use Money Flow
03/18/04 10:19:57 AMby Kevin Hopson
Money flow for XTO Energy has been negative recently but the trend may be ready to reverse.
Position: Accumulate
| One indicator I like to use when evaluating a stock is money flow. However, I am not referring to the typical Chaikin Money Flow (CMF) indicator that many chartists tend to use. Though CMF is a good measure of accumulation/distribution activity, I like to use a more primitive and simple approach, such as the money flow index. The money flow index measures positive money flow versus total money flow over a given period of time. I prefer to use a 10-day moving average but traders can use whatever time frame they want. |
| Calculations for the money flow index are quite simple. You start off by adding the high, low and closing price of the stock (or whatever investment vehicle you are tracking), then divide the sum of these prices by 3 to get what is known as your "typical price." Once you get your typical price, you multiply this number by the daily volume to get your raw money flow figure. If the typical price is higher than the prior day's typical price, then the money flow is positive. If the typical price is lower than the prior day's typical price, then the money flow is negative. If you set this up in Excel, you can color code your numbers red and green to represent negative and positive money flow. The only thing left to do is to calculate the money flow index using a moving average of your choice. As I stated before, I like to use a 10-day moving average but different traders have different time frames. Just remember that a moving average in a shorter time frame can cause whipsaws, while a moving average in a longer time frame can be a lagging indicator. As a result, you want to find a time frame that works well. |

|
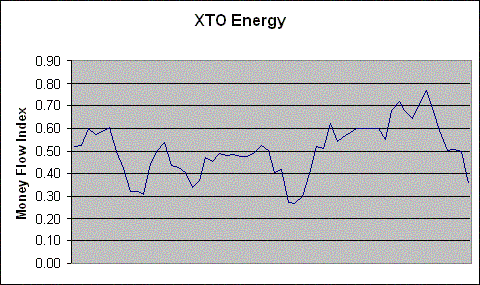
| Figure 1: Money flow index. |
| Graphic provided by: Excel. |
| |
| Once you find a suitable time frame, add the positive money flow during that period and divide it by the total money flow. This is your money flow index. If you look at the chart for XTO Energy (XTO), you will see how this works. Notice how money flow tends to reverse at both the 30 and 70 percent levels. This is very similar to the stochastics indicator, which shows oversold and overbought conditions. Though some traders like to use 20 and 80 percent as their oversold and overbought levels, respectively, I have found the 30 and 70 percent levels work just fine. In any event, watch these levels carefully to determine potential reversal points. |
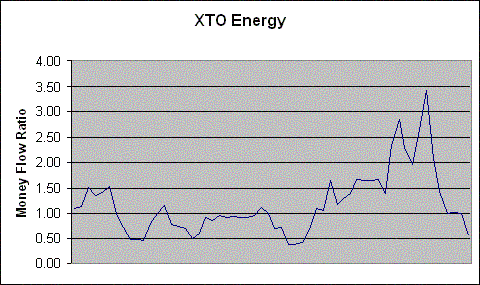
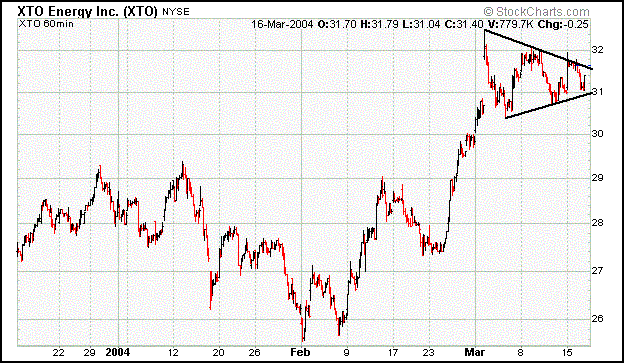
 Figure 2: Money flow ratio. Another variation I like to use is the money flow ratio. This is calculated by taking the positive money flow over a given period of time and dividing it by the negative money flow. A reading over 1.0 is considered positive, while a reading below 1.0 is considered negative. I do not use this as a leading indicator as much as I do a confirming indicator. For example, if the money flow index is above 70 and the money flow ratio is spiking to new highs, as was recently the case with XTO Energy, it is a good indication that prices will pull back. However, when the money flow index and money flow ratio are reaching extreme levels to the downside, you should see just the opposite - a bounce in prices. This exact situation appears to be playing out for XTO Energy right now. Notice how the money flow index is approaching the 30 percent level (oversold territory), while the money flow ratio is approaching prior bouncing points at around 50. Since XTO Energy has formed a bullish triangle on the 60-minute chart over the past two weeks and is currently finding support along its 10-day moving average ($31.25), the stock could see a move to the upside very soon. |
 Figure 3: XTO's daily chart. Chart provided by Stockcharts.com. |
Kevin has been a technical analyst for roughly 10 years now. Previously, Kevin owned his own business and acted as a registered investment advisor, specializing in energy. He was also a freelance oil analyst for Orient Trading Co., a commodity futures trading firm in Japan. Kevin is currently a freelance writer.
| Glen Allen, VA | |
| E-mail address: | hopson_1@yahoo.com |
Click here for more information about our publications!
Comments
Date: 03/18/04Rank: 5Comment:

Request Information From Our Sponsors
- StockCharts.com, Inc.
- Candle Patterns
- Candlestick Charting Explained
- Intermarket Technical Analysis
- John Murphy on Chart Analysis
- John Murphy's Chart Pattern Recognition
- John Murphy's Market Message
- MurphyExplainsMarketAnalysis-Intermarket Analysis
- MurphyExplainsMarketAnalysis-Visual Analysis
- StockCharts.com
- Technical Analysis of the Financial Markets
- The Visual Investor
- VectorVest, Inc.
- Executive Premier Workshop
- One-Day Options Course
- OptionsPro
- Retirement Income Workshop
- Sure-Fire Trading Systems (VectorVest, Inc.)
- Trading as a Business Workshop
- VectorVest 7 EOD
- VectorVest 7 RealTime/IntraDay
- VectorVest AutoTester
- VectorVest Educational Services
- VectorVest OnLine
- VectorVest Options Analyzer
- VectorVest ProGraphics v6.0
- VectorVest ProTrader 7
- VectorVest RealTime Derby Tool
- VectorVest Simulator
- VectorVest Variator
- VectorVest Watchdog
