HOT TOPICS LIST
- MACD
- Fibonacci
- RSI
- Gann
- ADXR
- Stochastics
- Volume
- Triangles
- Futures
- Cycles
- Volatility
- ZIGZAG
- MESA
- Retracement
- Aroon
INDICATORS LIST
LIST OF TOPICS
PRINT THIS ARTICLE
by Koos van der Merwe
The terrorist act in Spain has led to a change in government and the threat of a withdrawal of troops from Iraq. Has Al Qaeda won? What does the Dow say?
Position: N/A
Koos van der Merwe
Has been a technical analyst since 1969, and has worked as a futures and options trader with First Financial Futures in Johannesburg, South Africa.
PRINT THIS ARTICLE
GANN ANGLE
Gann, Elliott And The Dow
03/18/04 10:12:52 AMby Koos van der Merwe
The terrorist act in Spain has led to a change in government and the threat of a withdrawal of troops from Iraq. Has Al Qaeda won? What does the Dow say?
Position: N/A
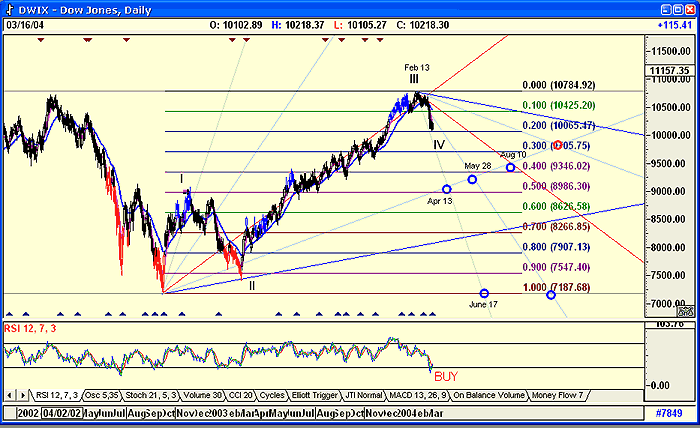
| The questions above are extremely complex, and recent events have shown the extent a major terrorist attack can sway the financial markets. To find an answer, I have applied Gann fans and an Elliot wave count to a daily chart of the Dow. |
| The chart of Dow starts on October 8, 2002 and continues until March 16, 2004. The Gann fan's 1 x 1 angles are at a scale 1 of 10. Notice how closely it follows the trend of the Dow upwards. From the high on February 13, 2004, I have drawn a down fan. I have also drawn the division of the range between the low on October 8th and the high on February 13th in tenths rather than the traditional eighths. This is because I believe that with trading in decimals, chart patterns have changed. |

|
| Daily chart of the Dow. |
| Graphic provided by: AdvancedGET. |
| |
| Where the angles cross each other, and cross the horizontals drawn from October 8, 2002 and March 16, 2004, I have drawn in circles that identify future possible cyclical correction points. Finally, I have highlighted a possible wave count, which suggests that the Dow could be completing a wave 4 down, and could now start moving into a rising wave 5. This appears to be confirmed as the Dow finds support at 10065, the 20 level of the division of the range, as well as by the RSI indicator, which has given a buy signal. |
| To conclude, the chart is suggesting that the Dow could start rising in a fifth wave up. Dates shown on the chart could be corrections, either highs or lows, as the index moves to new highs. A move above 10425 will confirm the up move. So, for the short-term, it looks like Al Qaeda is no longer influencing the market and has lost. |
Has been a technical analyst since 1969, and has worked as a futures and options trader with First Financial Futures in Johannesburg, South Africa.
| Address: | 3256 West 24th Ave |
| Vancouver, BC | |
| Phone # for sales: | 6042634214 |
| E-mail address: | petroosp@gmail.com |
Click here for more information about our publications!
PRINT THIS ARTICLE

|

Request Information From Our Sponsors
- StockCharts.com, Inc.
- Candle Patterns
- Candlestick Charting Explained
- Intermarket Technical Analysis
- John Murphy on Chart Analysis
- John Murphy's Chart Pattern Recognition
- John Murphy's Market Message
- MurphyExplainsMarketAnalysis-Intermarket Analysis
- MurphyExplainsMarketAnalysis-Visual Analysis
- StockCharts.com
- Technical Analysis of the Financial Markets
- The Visual Investor
- VectorVest, Inc.
- Executive Premier Workshop
- One-Day Options Course
- OptionsPro
- Retirement Income Workshop
- Sure-Fire Trading Systems (VectorVest, Inc.)
- Trading as a Business Workshop
- VectorVest 7 EOD
- VectorVest 7 RealTime/IntraDay
- VectorVest AutoTester
- VectorVest Educational Services
- VectorVest OnLine
- VectorVest Options Analyzer
- VectorVest ProGraphics v6.0
- VectorVest ProTrader 7
- VectorVest RealTime Derby Tool
- VectorVest Simulator
- VectorVest Variator
- VectorVest Watchdog
