HOT TOPICS LIST
- MACD
- Fibonacci
- RSI
- Gann
- ADXR
- Stochastics
- Volume
- Triangles
- Futures
- Cycles
- Volatility
- ZIGZAG
- MESA
- Retracement
- Aroon
INDICATORS LIST
LIST OF TOPICS
PRINT THIS ARTICLE
by Gary Grosschadl
Boeing, like many others, fell below its 50-day EMA as the overall markets tunrned south. The hammer signal formed on March 16, hints at a possible bounce here.
Position: Accumulate
Gary Grosschadl
Independent Canadian equities trader and technical analyst based in Peterborough
Ontario, Canada.
PRINT THIS ARTICLE
CHART ANALYSIS
Boeing Co. Tries To Hammer Out A Bottom
03/18/04 09:47:01 AMby Gary Grosschadl
Boeing, like many others, fell below its 50-day EMA as the overall markets tunrned south. The hammer signal formed on March 16, hints at a possible bounce here.
Position: Accumulate
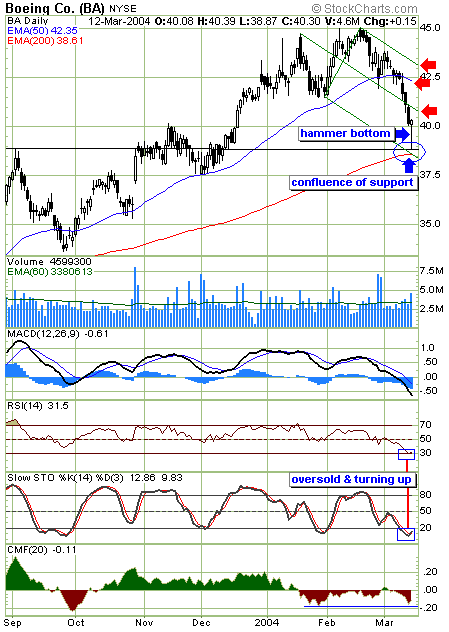
| A hammer candlestick forming on abnormally large volume often marks a bottom after a substantial decline. The long tail or lower shadow shows how traders were quick to buy the stock at what was perceived to be bargain basement prices as the stock recovered in the close. The low of the day came at a confluence of support via a previous resistance level from last September -- the often significant 200-day EMA, and the lower median line of the green pitchfork. |
| Several indicators are worth noting. The RSI (relative strength index) and stochastics are both in oversold territory and show early signs of turning up. The CMF or Chaiken Money Flow indicator shows positive divergence to price action. The CMF has not confirmed the lower price move (as compared to last February) with a corresponding move to a new low on the CMF graph. This is bullish. |

|
| Boeing dives to a possible bottom hammer. |
| Graphic provided by: Stockcharts.com. |
| |
| Confirmation of bullishness comes with a close above the hammer candlestick body and this should also see stochastics rise above the 20 level. Should an upleg ensue, several resistance levels are suggested that bear watching. These are the pitchfork median line (near $41), the 50-day EMA (currently $42.35) and the upper median line (near $43). The downward facing pitchfork is a reminder that the trend, as far as the pitchfork is concerned, remains bearish until the upper trendline is surpassed. This suggests that a position here is a short-term accumulation only unless the bulls drive the stock past the upper trendline in a convincing fashion. |
Independent Canadian equities trader and technical analyst based in Peterborough
Ontario, Canada.
| Website: | www.whatsonsale.ca/financial.html |
| E-mail address: | gwg7@sympatico.ca |
Click here for more information about our publications!
Comments
Date: 03/23/04Rank: 3Comment:

Request Information From Our Sponsors
- StockCharts.com, Inc.
- Candle Patterns
- Candlestick Charting Explained
- Intermarket Technical Analysis
- John Murphy on Chart Analysis
- John Murphy's Chart Pattern Recognition
- John Murphy's Market Message
- MurphyExplainsMarketAnalysis-Intermarket Analysis
- MurphyExplainsMarketAnalysis-Visual Analysis
- StockCharts.com
- Technical Analysis of the Financial Markets
- The Visual Investor
- VectorVest, Inc.
- Executive Premier Workshop
- One-Day Options Course
- OptionsPro
- Retirement Income Workshop
- Sure-Fire Trading Systems (VectorVest, Inc.)
- Trading as a Business Workshop
- VectorVest 7 EOD
- VectorVest 7 RealTime/IntraDay
- VectorVest AutoTester
- VectorVest Educational Services
- VectorVest OnLine
- VectorVest Options Analyzer
- VectorVest ProGraphics v6.0
- VectorVest ProTrader 7
- VectorVest RealTime Derby Tool
- VectorVest Simulator
- VectorVest Variator
- VectorVest Watchdog
