HOT TOPICS LIST
- MACD
- Fibonacci
- RSI
- Gann
- ADXR
- Stochastics
- Volume
- Triangles
- Futures
- Cycles
- Volatility
- ZIGZAG
- MESA
- Retracement
- Aroon
INDICATORS LIST
LIST OF TOPICS
PRINT THIS ARTICLE
by Gary Grosschadl
General Electric (GE), one of the market's bellweather stocks, has been sliding down hard. It has now reached an important support level, will it hold?
Position: Hold
Gary Grosschadl
Independent Canadian equities trader and technical analyst based in Peterborough
Ontario, Canada.
PRINT THIS ARTICLE
CHART ANALYSIS
General Electric Co. Testing Major Support
03/16/04 11:41:51 AMby Gary Grosschadl
General Electric (GE), one of the market's bellweather stocks, has been sliding down hard. It has now reached an important support level, will it hold?
Position: Hold
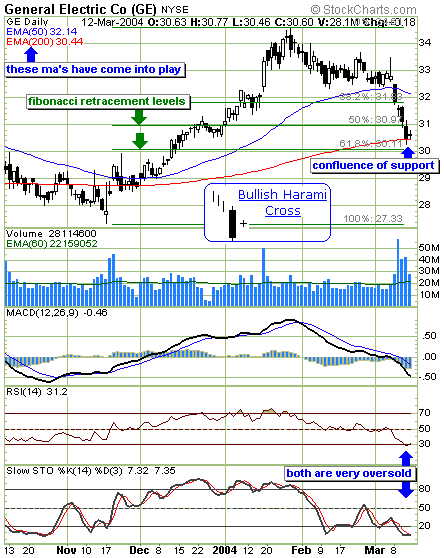
| A day after GE broke under its 50-day EMA support, the Dow followed suit and several more down days followed. Now the stock is at a confluence of support and the action the next several days may be critical. This probable support area has three support parameters. An important Fibonacci level of 61.8% at $30.11, a 200-day EMA at $30.44, and a suggestive candle pattern. The harami cross (as depicted) is considered to be a major reversal pattern. Although they are more effective at market tops, they can also call market bottoms. As with most patterns, next day confirmation is important. A move above the cross shows a potential move back up while a close below the cross would negate the bullish implication and most likely lead to a test of $30 support. |
| The two lower indicators (relative strength index and stochastics) both show very oversold conditions and hint at a possible turnaround. It's usually best to have the stochastics rise above the 20 level before putting on a bullish hat. |

|
| GE plunges along with the overall indexes. |
| Graphic provided by: Stockcharts.com. |
| |
| A close below the $30 threshold would be very bearish. But a bounce in the area between $30 and $30.50 would encourage some bullish speculation. Should an upleg develop, traders should watch for a possible balk at 20-day EMA which could provide overhead resistance. This could be the failure mark as short-term traders sell into likely resistance. Failure at or near this mark could keep GE in a downward trend. |
Independent Canadian equities trader and technical analyst based in Peterborough
Ontario, Canada.
| Website: | www.whatsonsale.ca/financial.html |
| E-mail address: | gwg7@sympatico.ca |
Click here for more information about our publications!
Comments
Date: 03/17/04Rank: 3Comment:

|

Request Information From Our Sponsors
- StockCharts.com, Inc.
- Candle Patterns
- Candlestick Charting Explained
- Intermarket Technical Analysis
- John Murphy on Chart Analysis
- John Murphy's Chart Pattern Recognition
- John Murphy's Market Message
- MurphyExplainsMarketAnalysis-Intermarket Analysis
- MurphyExplainsMarketAnalysis-Visual Analysis
- StockCharts.com
- Technical Analysis of the Financial Markets
- The Visual Investor
- VectorVest, Inc.
- Executive Premier Workshop
- One-Day Options Course
- OptionsPro
- Retirement Income Workshop
- Sure-Fire Trading Systems (VectorVest, Inc.)
- Trading as a Business Workshop
- VectorVest 7 EOD
- VectorVest 7 RealTime/IntraDay
- VectorVest AutoTester
- VectorVest Educational Services
- VectorVest OnLine
- VectorVest Options Analyzer
- VectorVest ProGraphics v6.0
- VectorVest ProTrader 7
- VectorVest RealTime Derby Tool
- VectorVest Simulator
- VectorVest Variator
- VectorVest Watchdog
