HOT TOPICS LIST
- MACD
- Fibonacci
- RSI
- Gann
- ADXR
- Stochastics
- Volume
- Triangles
- Futures
- Cycles
- Volatility
- ZIGZAG
- MESA
- Retracement
- Aroon
INDICATORS LIST
LIST OF TOPICS
PRINT THIS ARTICLE
by Kevin Hopson
As expected, natural gas prices broke to the upside from a falling wedge formation but is there more steam left in the rally?
Position: Hold
Kevin Hopson
Kevin has been a technical analyst for roughly 10 years now. Previously, Kevin owned his own business and acted as a registered investment advisor, specializing in energy. He was also a freelance oil analyst for Orient Trading Co., a commodity futures trading firm in Japan. Kevin is currently a freelance writer.
PRINT THIS ARTICLE
TECHNICAL ANALYSIS
What's Next For Natural Gas?
03/16/04 11:44:30 AMby Kevin Hopson
As expected, natural gas prices broke to the upside from a falling wedge formation but is there more steam left in the rally?
Position: Hold
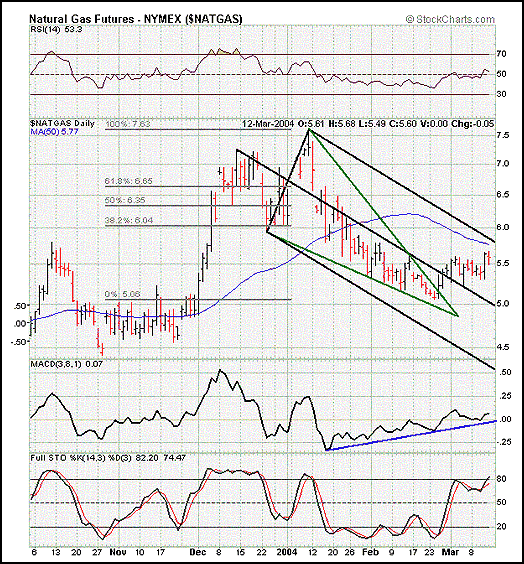
| I touched on natural gas several weeks ago, predicting that prices would see a move to the upside in the near-term. I based this prediction on two factors - a falling wedge formation and bullish divergences on the chart. More specifically, the moving average convergence/divergence (MACD) was putting in higher lows despite lower prices. This is usually a sign of a forthcoming bottom. Coupled with the falling wedge formation, which normally breaks to the upside, I was bullish on natural gas in the short-term. |
| As you can see in the chart, prices successfully broke out of the falling wedge formation late last month and have now moved above the black median line. Now that this has occurred, what is next for natural gas? A lot will depend on what prices do in the near-term. Notice that the top black parallel line and the continuous contract's 50-day moving average ($5.77) are both converging around the $5.80 level. As a result, this price level will likely act as significant resistance in the near-term. |

|
| Graphic provided by: Stockcharts.com. |
| |
| If the contract can overcome resistance here, the two-and-a-half month downtrend will reverse, likely paving the way for a more significant rally. Therefore, my minimum price target would be $6.04, the site of the 38.2 percent retracement level from the January - February decline. However, since a break of resistance at $5.80 would indicate a short-term trend reversal, I think the 50 percent ($6.35) and 61.8 percent ($6.65) retracement levels would be more appropriate upside targets. In the interim, keep a close eye on what develops in the near-term. |
Kevin has been a technical analyst for roughly 10 years now. Previously, Kevin owned his own business and acted as a registered investment advisor, specializing in energy. He was also a freelance oil analyst for Orient Trading Co., a commodity futures trading firm in Japan. Kevin is currently a freelance writer.
| Glen Allen, VA | |
| E-mail address: | hopson_1@yahoo.com |
Click here for more information about our publications!
PRINT THIS ARTICLE

Request Information From Our Sponsors
- StockCharts.com, Inc.
- Candle Patterns
- Candlestick Charting Explained
- Intermarket Technical Analysis
- John Murphy on Chart Analysis
- John Murphy's Chart Pattern Recognition
- John Murphy's Market Message
- MurphyExplainsMarketAnalysis-Intermarket Analysis
- MurphyExplainsMarketAnalysis-Visual Analysis
- StockCharts.com
- Technical Analysis of the Financial Markets
- The Visual Investor
- VectorVest, Inc.
- Executive Premier Workshop
- One-Day Options Course
- OptionsPro
- Retirement Income Workshop
- Sure-Fire Trading Systems (VectorVest, Inc.)
- Trading as a Business Workshop
- VectorVest 7 EOD
- VectorVest 7 RealTime/IntraDay
- VectorVest AutoTester
- VectorVest Educational Services
- VectorVest OnLine
- VectorVest Options Analyzer
- VectorVest ProGraphics v6.0
- VectorVest ProTrader 7
- VectorVest RealTime Derby Tool
- VectorVest Simulator
- VectorVest Variator
- VectorVest Watchdog
