HOT TOPICS LIST
- MACD
- Fibonacci
- RSI
- Gann
- ADXR
- Stochastics
- Volume
- Triangles
- Futures
- Cycles
- Volatility
- ZIGZAG
- MESA
- Retracement
- Aroon
INDICATORS LIST
LIST OF TOPICS
PRINT THIS ARTICLE
by Ashwani Gujral
The S&P e-mini ended its agonizing rally on the daily chart and took the path of least resistance, which was down. This exhaustion pattern is called "Three Little Indians."
Position: N/A
Ashwani Gujral
He is founder of AGIP Securities Pvt. Ltd. which offers money management services, live chat rooms (during market hours) and independent technical analysis consultancy. The company has a big media presence from the likes of CNBC, NDTV Profit, and ZEE Business.
PRINT THIS ARTICLE
CHART ANALYSIS
S&P E-mini Futures Enter A Downtrend
03/19/04 12:26:34 PMby Ashwani Gujral
The S&P e-mini ended its agonizing rally on the daily chart and took the path of least resistance, which was down. This exhaustion pattern is called "Three Little Indians."
Position: N/A
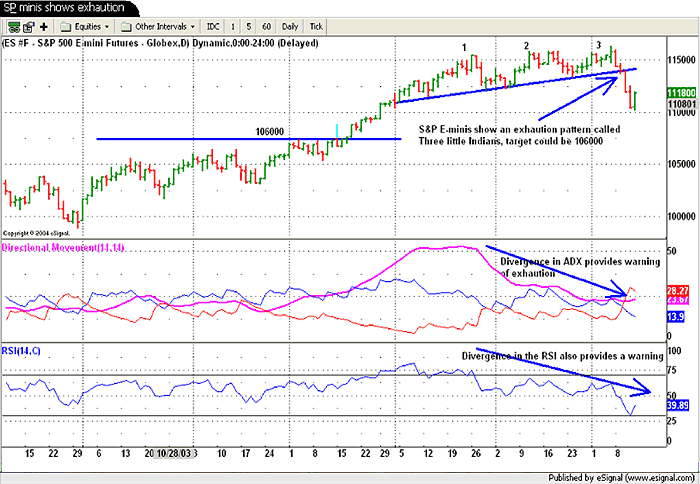
| The Three Little Indians is an exhaustion pattern consisting of three almost symmetrical peaks to the upside or three symmetrical troughs to the downside. This pattern has been discussed in the popular book Street Smarts by Linda Bradford Rashcke. This offers an almost riskless trade to the opposite side. There are various signs that this type of pattern may be forming, such as a divergence in the ADX and the RSI from price. Breaking of a trendline can be considered the trading signal. A possible target could be the first major support or resistance on the downside or upside respectively and the third peak or trough can be used as the stop. But remember, this is a short-term trading technique; it may or may not have longer term implications. |

|
| Figure 1: S&P e-mini daily chart. |
| Graphic provided by: www.esignal.com. |
| |
| On the daily S&P mini chart three almost symmetrical peaks have formed. As these peaks formed, the ADX and RSI have slowly lost strength. This divergence should continue until the price breaks through the trendline and falls below 115. The divergence of indicators takes a long time to play out, so actual positions should only be taken after the trendline break. A short position can be taken as soon as this occurs. In this case, I expect the price to drop to the 106 level. From there, the market may or may not break its long-term uptrend and this could be merely a sharp downward correction. |
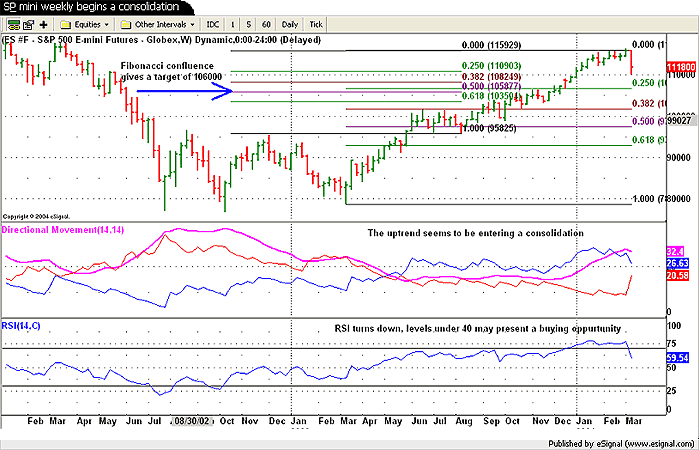
 Figure 2: S&P e-mini weekly chart. On the weekly chart, look for confirmation of signals and targets. I have done this by drawing Fibonacci retracments from various point and again have gotten a confluence at the 106 level. It would be prudent to book some profits here. Looking to the indicators, the ADX is starting to decline after touching a 30+ level, indicating consolidation and the RSI has dropped sharply. I would look for the S&P e-mini to consolidate between 116 and 106. There is, however, no indication on the weekly chart that the upward trend is reversing. |
He is founder of AGIP Securities Pvt. Ltd. which offers money management services, live chat rooms (during market hours) and independent technical analysis consultancy. The company has a big media presence from the likes of CNBC, NDTV Profit, and ZEE Business.
| Title: | Chief mkt strategist |
| Company: | AGIP Securities |
| India | |
| Phone # for sales: | 9871066337 |
| Website: | www.ashwanigujral.com |
| E-mail address: | contact@ashwanigujral.com |
Traders' Resource Links | |
| AGIP Securities has not added any product or service information to TRADERS' RESOURCE. | |
Click here for more information about our publications!
Comments
Date: 03/19/04Rank: 5Comment:

Request Information From Our Sponsors
- StockCharts.com, Inc.
- Candle Patterns
- Candlestick Charting Explained
- Intermarket Technical Analysis
- John Murphy on Chart Analysis
- John Murphy's Chart Pattern Recognition
- John Murphy's Market Message
- MurphyExplainsMarketAnalysis-Intermarket Analysis
- MurphyExplainsMarketAnalysis-Visual Analysis
- StockCharts.com
- Technical Analysis of the Financial Markets
- The Visual Investor
- VectorVest, Inc.
- Executive Premier Workshop
- One-Day Options Course
- OptionsPro
- Retirement Income Workshop
- Sure-Fire Trading Systems (VectorVest, Inc.)
- Trading as a Business Workshop
- VectorVest 7 EOD
- VectorVest 7 RealTime/IntraDay
- VectorVest AutoTester
- VectorVest Educational Services
- VectorVest OnLine
- VectorVest Options Analyzer
- VectorVest ProGraphics v6.0
- VectorVest ProTrader 7
- VectorVest RealTime Derby Tool
- VectorVest Simulator
- VectorVest Variator
- VectorVest Watchdog
