

HOT TOPICS LIST
- MACD
- Fibonacci
- RSI
- Gann
- ADXR
- Stochastics
- Volume
- Triangles
- Futures
- Cycles
- Volatility
- ZIGZAG
- MESA
- Retracement
- Aroon
INDICATORS LIST
LIST OF TOPICS
PRINT THIS ARTICLE
by Ashwani Gujral
Most stocks or commodities cannot maintain a sharp rise or fall for an extended period of time. Sharp moves in any direction are often followed by a consolidation pattern, with an eventual breakout or breakdown in the same direction. The Barr Labs chart is one such example.
Position: Sell
Ashwani Gujral
He is founder of AGIP Securities Pvt. Ltd. which offers money management services, live chat rooms (during market hours) and independent technical analysis consultancy. The company has a big media presence from the likes of CNBC, NDTV Profit, and ZEE Business.
PRINT THIS ARTICLE
CONSOLID FORMATION
Barr Labs Breaks Down From Consolidation Pattern
03/17/04 10:14:24 AMby Ashwani Gujral
Most stocks or commodities cannot maintain a sharp rise or fall for an extended period of time. Sharp moves in any direction are often followed by a consolidation pattern, with an eventual breakout or breakdown in the same direction. The Barr Labs chart is one such example.
Position: Sell
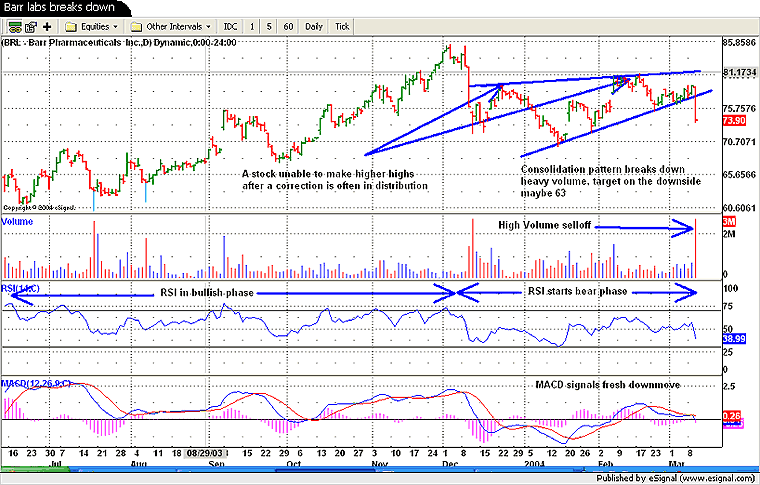
| Barr Labs fell sharply from the $85 level to about $72 and then went into a consolidation pattern as can be seen in daily chart. This consolidation pattern has broken down on very heavy volume and the stock now seems headed to the $63 level in the short-term. This target is calculated by extrapolating the move prior to the consolidation pattern to the breakdown of the consolidation pattern. |
|
| Figure 1: Daily chart of Barr Labs. |
| Graphic provided by: www.esignal.com. |
| |
| After a correction, it is almost impossible to determine if the stock is going to rally or if it has suddenly entered a downtrend. Watch for a series of lower highs, indicating that the stock is unable to hold on to higher levels. Such a pattern can be both a consolidation in the fresh down move or a distribution pattern, depending on the time frame you are looking at. The breakdown in Barr Labs has occurred on high volume and that makes this significant and the daily RSI has shifted its range from bullish to bearish. |
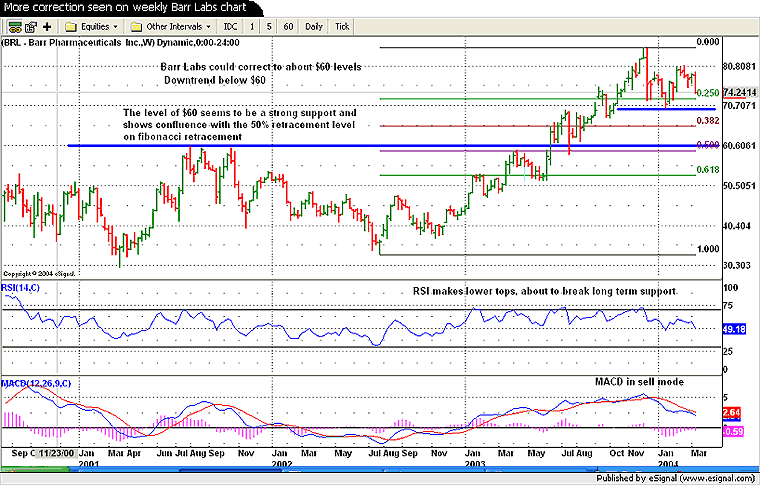 Figure 2: Weekly chart of Barr Labs. On the weekly chart, Barr Labs has made a lower top as well and a breakdown below the $70 level could lead to the $60 level. If the stock goes above $80, it may restart its upmove. At this point this downmove appears to be a correction of the strong upmove from $32 to $85 level. Also $60 has been both a strong resistance and support level in the past and converges with a 50% retracement of the entire upmove. Hence, any move below the $60 level is likely to be downtrend. The RSI seems ready to break a support that has held on for many months. This should be taken seriously as moves in the indicator often lead the price. The MACD on the weekly chart is in a sell mode as well. |
He is founder of AGIP Securities Pvt. Ltd. which offers money management services, live chat rooms (during market hours) and independent technical analysis consultancy. The company has a big media presence from the likes of CNBC, NDTV Profit, and ZEE Business.
| Title: | Chief mkt strategist |
| Company: | AGIP Securities |
| India | |
| Phone # for sales: | 9871066337 |
| Website: | www.ashwanigujral.com |
| E-mail address: | contact@ashwanigujral.com |
Traders' Resource Links | |
| AGIP Securities has not added any product or service information to TRADERS' RESOURCE. | |
Click here for more information about our publications!
Comments
Date:�03/18/04Rank:�3Comment:�

Request Information From Our Sponsors
- StockCharts.com, Inc.
- Candle Patterns
- Candlestick Charting Explained
- Intermarket Technical Analysis
- John Murphy on Chart Analysis
- John Murphy's Chart Pattern Recognition
- John Murphy's Market Message
- MurphyExplainsMarketAnalysis-Intermarket Analysis
- MurphyExplainsMarketAnalysis-Visual Analysis
- StockCharts.com
- Technical Analysis of the Financial Markets
- The Visual Investor
- VectorVest, Inc.
- Executive Premier Workshop
- One-Day Options Course
- OptionsPro
- Retirement Income Workshop
- Sure-Fire Trading Systems (VectorVest, Inc.)
- Trading as a Business Workshop
- VectorVest 7 EOD
- VectorVest 7 RealTime/IntraDay
- VectorVest AutoTester
- VectorVest Educational Services
- VectorVest OnLine
- VectorVest Options Analyzer
- VectorVest ProGraphics v6.0
- VectorVest ProTrader 7
- VectorVest RealTime Derby Tool
- VectorVest Simulator
- VectorVest Variator
- VectorVest Watchdog