HOT TOPICS LIST
- MACD
- Fibonacci
- RSI
- Gann
- ADXR
- Stochastics
- Volume
- Triangles
- Futures
- Cycles
- Volatility
- ZIGZAG
- MESA
- Retracement
- Aroon
INDICATORS LIST
LIST OF TOPICS
PRINT THIS ARTICLE
by David Penn
Once again, a positive stochastic divergence suggests a low in the S&P 500.
Position: N/A
David Penn
Technical Writer for Technical Analysis of STOCKS & COMMODITIES magazine, Working-Money.com, and Traders.com Advantage.
PRINT THIS ARTICLE
ELLIOTT WAVE
Stochastic Divergences, Diamonds And Elliott Waves
03/12/04 01:34:09 PMby David Penn
Once again, a positive stochastic divergence suggests a low in the S&P 500.
Position: N/A
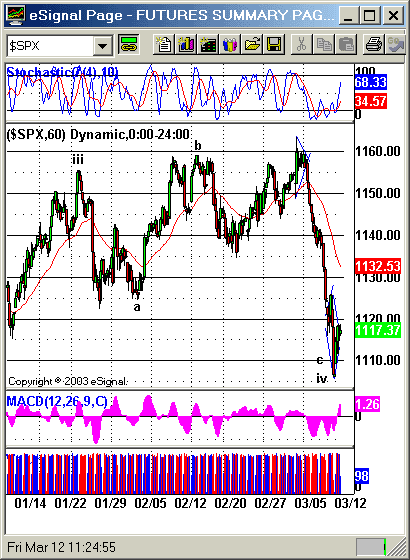
| In a recent Traders.com Advantage article, ("Temporary Triangle Trouble in the Hourly S&P 500," March 9, 2004), I anticipated that the rally that began in late February might be coming to a temporary end. The "end" to which I referred was a symmetrical triangle that, because of its position, was more likely to break to the downside than breakout to the upside. This much happened as suggested, as the S&P 500 broke from its hourly symmetrical triangle around 1157 on March 8 and proceeded to swiftly collapse to about 1106 by March 11. This collapse was worse than I believed it would be. The symmetrical triangle pattern pointed to a minimum decline to 1144.88. I also believed that the early March peak represented a minuette wave "1" peak, and that the correction that began with the symmetrical triangle would find support at the level of the subminuette wave "four" low (see "Temporary Triangle Trouble. . ." for a breakdown on the wave count at the time), which was at 1143.78. |
| There were a few caveats I thought deserved note at the time. First, I pointed out that the wave count for the minuette wave "1" was flawed because of an overlap between subminuette wave "1" and subminuette wave "4". The overlap was only a point. But it was an overlap and I cautioned that this presented a problem for that particular wave count. A second caveat had to do with the tendency of initial Elliott wave counts to be shorter in amplitude and duration than they should be. In response to both flaws (realized and unrealized at the time) I suggested Elliotticians be prepared to make initial wave counts part of larger wave counts if unfolding price action dictated. Well, it may be time to take a little dictation from the unfolding price action. When the S&P 500 smashed below the downside targets of 1144.88 and 1143.78 and continued to move significantly lower, the notion that the price decline represented a minute wave "2" correction became unsustainable. Importantly, what this also meant was that the minute wave "iv" (also minuette wave "c") bottom I suggested might have occurred on February 24th was in fact the first leg of the minuette wave "c" -- instead of being the last leg of that wave. |

|
| Figure 1: Far from ending in late February, the minute wave "iv" appears to be concluding closer to mid-March. |
| Graphic provided by: eSignal. |
| |
| In other words, minute wave "iv" has changed -- specifically, it has become larger. What I had believed was the minute wave "iv" low appears instead to be the minuette wave "a" low. Looking now at what appears to be the entirety of minute wave "iv," the current "portrait" of minute wave "iv" is far more satisfying than the previous "stunted" minute wave "iv" (flaws and all) I'd described in my previous article on the top. But the point of this article was to underscore the possibility that the current price action is tracing out a minute wave "iv" bottom. One of the reasons for bullishness near the end of February was, in my opinion, the clear, positive stochastic divergence between the higher lows in the 7/10 stochastic and the lower lows in the hourly S&P 500. It was this tripartite pattern of three higher lows versus three lower lows that encouraged me to believe that a bottom had been put in back on February 24th. I was right that those lows represented a bottom. But I was wrong about the degree of that bottom. |
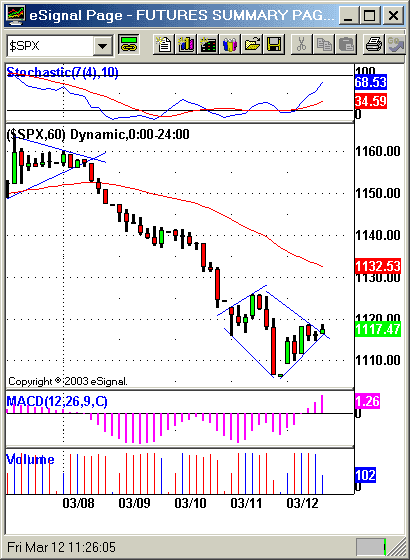
Current price action seems to afford us with another chance at calling a bottom. The sharp decline in the S&P 500 from March 8 to March 12 was relentless in its intensity, but by March 11th the S&P 500 had already begun a positive -- or bullish -- stochastic divergence. The S&P 500 made three lower lows since breaking free from the symmetrical triangle/subminuette wave "b" top: the first in the 12 noon hour of March 9th at 1136.94, the second in the 6:00 am hour of March 11th at 1115.85, and the third in the 12 noon hour of March 11th at 1106.58. Each of these lows was accompanied by a higher low in the stochastic. Not only is this a classic positive divergence, but it is remarkably similar to the positive divergence that accompanied the February 24th low and anticipated the subsequent rally in the S&P 500 from 1134 to 1163. Figure 2: The upside from a bullish breakout from this diamond pattern could send the S&P 500 back to a test of resistance at the 50-hour EMA. Another arrow in the bullish quiver is the potential diamond bottom that appears to be developing in the hourly S&P 500 -- as well as in the June e-mini S&P 500 futures contract. As of this writing (11:00 am hour, March 12), prices appear to have broken out of this diamond pattern to the upside. If the diamond pattern turns out to be valid, then a minimum upside to 1136 should be anticipated -- along with a confrontation with the S&P 500's 50-hour exponential moving average. This upside, incidentally, is calculated by adding the size of the diamond formation (1125.96 - 1106.15 = 19.81) and adding that difference to the value at the breakout point (approximately 1116.30). |
| Were the diamond breakout to reverse and head downward, then that difference would be subtracted from the breakout point, suggesting in that case a minimum downside of 1096.49. I should add that such an event would put into question even this new, "expanded" minute wave "iv." Stay tuned. |
Technical Writer for Technical Analysis of STOCKS & COMMODITIES magazine, Working-Money.com, and Traders.com Advantage.
| Title: | Technical Writer |
| Company: | Technical Analysis, Inc. |
| Address: | 4757 California Avenue SW |
| Seattle, WA 98116 | |
| Phone # for sales: | 206 938 0570 |
| Fax: | 206 938 1307 |
| Website: | www.Traders.com |
| E-mail address: | DPenn@traders.com |
Traders' Resource Links | |
| Charting the Stock Market: The Wyckoff Method -- Books | |
| Working-Money.com -- Online Trading Services | |
| Traders.com Advantage -- Online Trading Services | |
| Technical Analysis of Stocks & Commodities -- Publications and Newsletters | |
| Working Money, at Working-Money.com -- Publications and Newsletters | |
| Traders.com Advantage -- Publications and Newsletters | |
| Professional Traders Starter Kit -- Software | |
Click here for more information about our publications!
Comments

Request Information From Our Sponsors
- StockCharts.com, Inc.
- Candle Patterns
- Candlestick Charting Explained
- Intermarket Technical Analysis
- John Murphy on Chart Analysis
- John Murphy's Chart Pattern Recognition
- John Murphy's Market Message
- MurphyExplainsMarketAnalysis-Intermarket Analysis
- MurphyExplainsMarketAnalysis-Visual Analysis
- StockCharts.com
- Technical Analysis of the Financial Markets
- The Visual Investor
- VectorVest, Inc.
- Executive Premier Workshop
- One-Day Options Course
- OptionsPro
- Retirement Income Workshop
- Sure-Fire Trading Systems (VectorVest, Inc.)
- Trading as a Business Workshop
- VectorVest 7 EOD
- VectorVest 7 RealTime/IntraDay
- VectorVest AutoTester
- VectorVest Educational Services
- VectorVest OnLine
- VectorVest Options Analyzer
- VectorVest ProGraphics v6.0
- VectorVest ProTrader 7
- VectorVest RealTime Derby Tool
- VectorVest Simulator
- VectorVest Variator
- VectorVest Watchdog
