

HOT TOPICS LIST
- MACD
- Fibonacci
- RSI
- Gann
- ADXR
- Stochastics
- Volume
- Triangles
- Futures
- Cycles
- Volatility
- ZIGZAG
- MESA
- Retracement
- Aroon
INDICATORS LIST
LIST OF TOPICS
PRINT THIS ARTICLE
by Koos van der Merwe
"Further, of bearish importance is that the Nasdaq has itself failed for the second time at a level below the previous top, while making new and lower lows. Bull markets make higher highs and higher lows; bear markets do the opposite."
Position: N/A
Koos van der Merwe
Has been a technical analyst since 1969, and has worked as a futures and options trader with First Financial Futures in Johannesburg, South Africa.
PRINT THIS ARTICLE
ELLIOTT WAVE
The Nasdaq: A Tough Call
03/15/04 09:08:55 AMby Koos van der Merwe
"Further, of bearish importance is that the Nasdaq has itself failed for the second time at a level below the previous top, while making new and lower lows. Bull markets make higher highs and higher lows; bear markets do the opposite."
Position: N/A
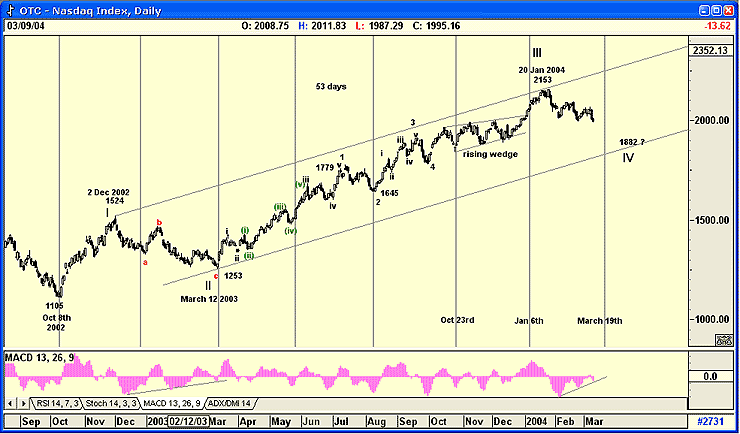
| This report was put out by Dennis Gartman of The Gartman Letter on Wednesday, March 10th, and with the market continuing to fall, and the Nasdaq having broken below the 2000 level, investors are starting to get very nervous. I have tried, with the following chart, to justify that nervousness, and to see whether there is any hope that a bull market may return to the Nasdaq in the very near future. Below is my Elliott wave count attempt. Time alone will tell whether it is accurate or not. |
| I have taken March 8th, 2002 as the start of my wave count. Wave I was from a low of 1105 on October 8th to a high of 1524 on December 2, 2002. Wave II made a complicated down wave as an abc correction, falling to 1253 on March 12, 2003. From this level I have a very complicated count to what I believe is Wave III at 2153 on January 20, 2004. The wave was complicated because of the rising wedge in the subwave which made the top of Wave II difficult to predict. I then drew a trendline from the high of Wave I to the high of Wave III, as shown, and then drew a support line parallel to this from the low of Wave II. This should give me a level that I can expect Wave IV to bottom at. I have also assumed that Wave II was a complicated wave. If so, Wave IV should be a simple wave, however, the count itself may decide that Wave II is simple, and it could be an easily recognizable abc correction. If so, Wave IV could be extremely complicated. So far, no easily identifiable pattern has formed, which suggests the latter. Wave theory also suggests that Wave IV should be equal in length to Wave II, and that Wave V should be equal in length to Wave I, unless a rising wedge forms. To determine possible target levels, I have made the following calculations. Wave I : 1524 - 1105 = 419 Wave II: 1524 - 1253 = 271 Wave III: 2153 - 1253 = 900 Forecast. Wave IV: 2153 - 271 = 1882 Wave V: 1882 + 419 = 2301 Wave IV could be 271 which means Nasdaq could fall to 1882 before correcting upwards. Wave V could be 419 in length, which means Nasdaq could rise to 2301 should there be no rising wedges or complicated subwaves forming. |
|
| Figure 1: My Elliott wave count of the Nasdaq Index. |
| Graphic provided by: AdvancedGET. |
| |
| Finally, I have included a cycle count of 53 days on the chart, which has been reasonably successful in identifying major lows although it appears to have completely missed a low on January 6th. This in itself could be a cyclical inversion, forecasting the fall in the Nasdaq that followed. Whether the cycle will revert to its normal count by March 19th or not is now debatable. I have also examined the above counts to see if any coincided with a Fibonacci ratio that would verify the Elliott count, but no ratios are obvious. A look at the MACD oscillator looks bullish and suggests a divergence buy signal. In addition, the change to the Nasdaq shorting regulations made on April 1st should affect the Index positively, but to what extent is uncertain. |
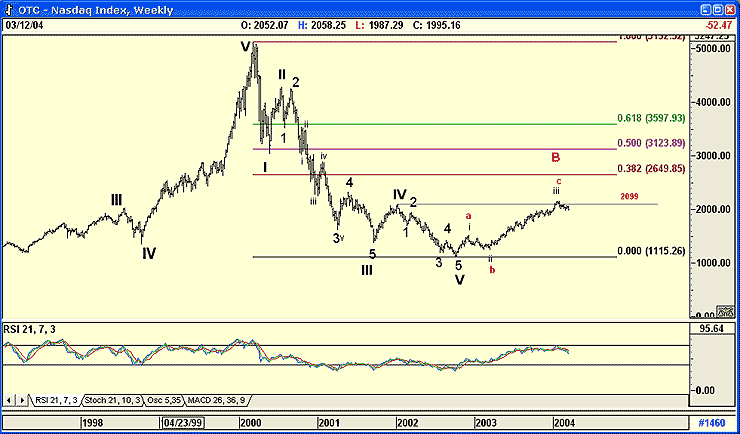 Figure 2: Weekly chart of the Nasdaq. Whatever wave structure the Nasdaq is completing, whether it is a major impulse wave up or a Wave A of major Wave B, caution prevails. Here I refer you to the second weekly chart, which shows the Nasdaq testing a major resistance level. The chart also suggests that the Nasdaq is tracing a Wave B upwards, with a Wave C collapse still to come. The index appears to have penetrated ever so slightly the resistance level at 2099, and with the RSI indicator, which is still bullish, is suggesting that it could continue to higher levels. I have included Fibonacci ratios from the high to the low as possible targets but these levels may be too enthusiastic. |
| To conclude, B-Waves are known as bull traps, because they are so difficult to forecast. Most B-Waves that I have seen are abcxabc patterns, but I have also seen many, many variations, some of them extremely complex. This Nasdaq count could be one of them. |
Has been a technical analyst since 1969, and has worked as a futures and options trader with First Financial Futures in Johannesburg, South Africa.
| Address: | 3256 West 24th Ave |
| Vancouver, BC | |
| Phone # for sales: | 6042634214 |
| E-mail address: | petroosp@gmail.com |
Click here for more information about our publications!
Comments
Date:�03/15/04Rank:�5Comment:�
Date:�03/17/04Rank:�4Comment:�

Request Information From Our Sponsors
- StockCharts.com, Inc.
- Candle Patterns
- Candlestick Charting Explained
- Intermarket Technical Analysis
- John Murphy on Chart Analysis
- John Murphy's Chart Pattern Recognition
- John Murphy's Market Message
- MurphyExplainsMarketAnalysis-Intermarket Analysis
- MurphyExplainsMarketAnalysis-Visual Analysis
- StockCharts.com
- Technical Analysis of the Financial Markets
- The Visual Investor
- VectorVest, Inc.
- Executive Premier Workshop
- One-Day Options Course
- OptionsPro
- Retirement Income Workshop
- Sure-Fire Trading Systems (VectorVest, Inc.)
- Trading as a Business Workshop
- VectorVest 7 EOD
- VectorVest 7 RealTime/IntraDay
- VectorVest AutoTester
- VectorVest Educational Services
- VectorVest OnLine
- VectorVest Options Analyzer
- VectorVest ProGraphics v6.0
- VectorVest ProTrader 7
- VectorVest RealTime Derby Tool
- VectorVest Simulator
- VectorVest Variator
- VectorVest Watchdog