HOT TOPICS LIST
- MACD
- Fibonacci
- RSI
- Gann
- ADXR
- Stochastics
- Volume
- Triangles
- Futures
- Cycles
- Volatility
- ZIGZAG
- MESA
- Retracement
- Aroon
INDICATORS LIST
LIST OF TOPICS
PRINT THIS ARTICLE
by Kevin Hopson
The Utilities Holders recently broke out of a bullish trading range, indicating the potential for higher prices. Could this be true in light of the Dow's recent breakdown?
Position: Hold
Kevin Hopson
Kevin has been a technical analyst for roughly 10 years now. Previously, Kevin owned his own business and acted as a registered investment advisor, specializing in energy. He was also a freelance oil analyst for Orient Trading Co., a commodity futures trading firm in Japan. Kevin is currently a freelance writer.
PRINT THIS ARTICLE
TECHNICAL ANALYSIS
Are Utility Stocks Headed Even Higher?
03/11/04 01:05:31 PMby Kevin Hopson
The Utilities Holders recently broke out of a bullish trading range, indicating the potential for higher prices. Could this be true in light of the Dow's recent breakdown?
Position: Hold
| Historically, utility companies have been considered a good leading indicator of stock prices, or at least the Dow Jones Industrial Average ($INDU). This is because utility companies are heavy borrowers. When utility stocks rise, investors are anticipating a fall in interest rates, which not only benefits highly leveraged utility companies but the rest of the market as well. As a result, the Dow Jones Utility Average ($UTIL) tends to lead the way in both bull markets and bear markets. |
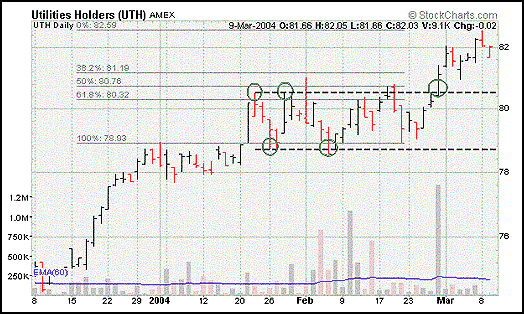
| So how do we explain the recent turn of events where the Dow Jones Industrial Average has been moving lower in light of higher utility prices? Maybe the charts can provide some insight. For example, if you look at the three-month chart for the Utilities Holders (UTH), which is a mirror image of the Dow Jones Utility Average, you will notice that utility stocks recently broke out of a bullish trading range. |

|
| Figure 1: UTH daily chart. |
| Graphic provided by: Stockcharts.com. |
| |
| As a result, UTH could eventually make its way up to the $83.60 to $85.20 range. I calculated this target range by taking the number of times that prices tested the upper channel line in alternate sequence (3), multiplying it by the width of the trading range ($80.40 - $78.80 = $1.60) and then adding this figure (3 x $1.60 = $4.80) to the bottom ($78.80 + $4.80 = $83.60) and top ($80.40 + $4.80 = $85.20) channel lines. If this holds true, you would assume the Dow Jones Industrial Average would eventually move higher too, right? |
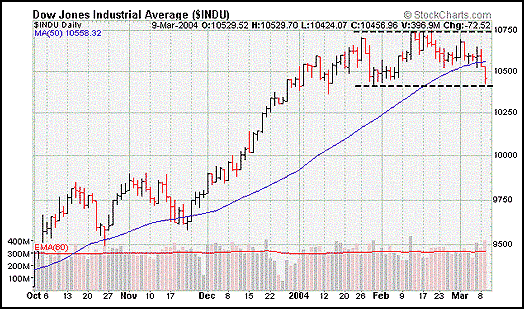
Looking at the INDU chart, you will notice that despite the recent breakdown below the 50-day moving average, the index is still stuck in a potentially bullish trading range. Could it be that the INDU will follow suit and eventually break to the upside like the utilities did in late February? That is the million dollar question. However, market sentiment towards utility stocks continues to be overly pessimistic, which is not indicative of a forthcoming top. Figure 2: INDU daily chart. |
| Short interest for the 20 stocks included in the Utilities Holders fund was 210.8M shares as of February 9. This amounts to a short interest ratio of 5.3x, meaning that it would take over five days for shorts to cover their positions based on the combined daily average volume of these companies (roughly 40.0M shares). Additionally, only 29 percent of the analysts covering these companies have buy ratings on them. As a result, there appears to be a lot of potential buying pressure to push these stocks higher. Even if UTH does pull back in the near-term, prices should find support around the $80.40 level, the site of the upper channel line and the 61.8 percent retracement level from the recent breakout rally. However, since the jury is still out, I would remain on the sidelines for the time being. |
Kevin has been a technical analyst for roughly 10 years now. Previously, Kevin owned his own business and acted as a registered investment advisor, specializing in energy. He was also a freelance oil analyst for Orient Trading Co., a commodity futures trading firm in Japan. Kevin is currently a freelance writer.
| Glen Allen, VA | |
| E-mail address: | hopson_1@yahoo.com |
Click here for more information about our publications!
Comments
Date: 03/15/04Rank: 4Comment:

Request Information From Our Sponsors
- StockCharts.com, Inc.
- Candle Patterns
- Candlestick Charting Explained
- Intermarket Technical Analysis
- John Murphy on Chart Analysis
- John Murphy's Chart Pattern Recognition
- John Murphy's Market Message
- MurphyExplainsMarketAnalysis-Intermarket Analysis
- MurphyExplainsMarketAnalysis-Visual Analysis
- StockCharts.com
- Technical Analysis of the Financial Markets
- The Visual Investor
- VectorVest, Inc.
- Executive Premier Workshop
- One-Day Options Course
- OptionsPro
- Retirement Income Workshop
- Sure-Fire Trading Systems (VectorVest, Inc.)
- Trading as a Business Workshop
- VectorVest 7 EOD
- VectorVest 7 RealTime/IntraDay
- VectorVest AutoTester
- VectorVest Educational Services
- VectorVest OnLine
- VectorVest Options Analyzer
- VectorVest ProGraphics v6.0
- VectorVest ProTrader 7
- VectorVest RealTime Derby Tool
- VectorVest Simulator
- VectorVest Variator
- VectorVest Watchdog
