HOT TOPICS LIST
- MACD
- Fibonacci
- RSI
- Gann
- ADXR
- Stochastics
- Volume
- Triangles
- Futures
- Cycles
- Volatility
- ZIGZAG
- MESA
- Retracement
- Aroon
INDICATORS LIST
LIST OF TOPICS
PRINT THIS ARTICLE
by Gary Grosschadl
Broadcom enjoyed a two month gain taking it from $34 to $44. Since then it has consolidated in a recognizable pattern.
Position: Sell
Gary Grosschadl
Independent Canadian equities trader and technical analyst based in Peterborough
Ontario, Canada.
PRINT THIS ARTICLE
TRIANGLES
Broadcom Corp. Looking Bearish
03/11/04 07:56:47 AMby Gary Grosschadl
Broadcom enjoyed a two month gain taking it from $34 to $44. Since then it has consolidated in a recognizable pattern.
Position: Sell
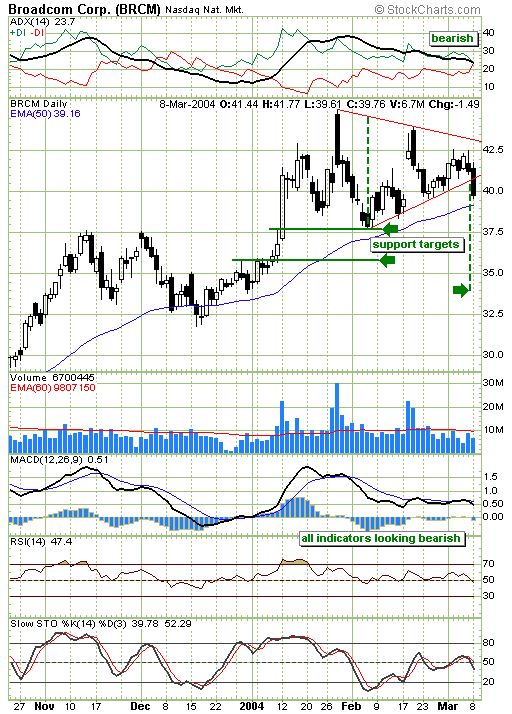
| A pennant, marked by the two red lines, has formed on Broadcom's (BRCM) daily chart. This type of formation (small symmetrical triangle) is normally interpreted to be a short-term continuation pattern, however as with all patterns, it is the break outside of the pattern that is most meaningful, either confirming or negating the prior assumption. Broadcom's downside break came on unconvincing volume so additional confirmation is probably prudent. |
| Looking at the displayed indicators, all point toward bearishness and this adds weight to the negative implication of this pennant's downside break. The nearby 50-day EMA is probably good confirmation going forward as to whether this is a more serious break or not. A bounce off this moving average may lead to a test of the lower trendline and the outcome there should be a more telling signal. On the positive side, a move back inside the pennant would negate the previous bearish implication and most likely pave the way for an eventual move to the upper trendline. The negative view would be a failure either at the moving average support or the retest of the lower pennant trendline. |

|
| Daily chart shows a downside move underway. |
| Graphic provided by: Stockcharts.com. |
| |
| If this is the case then three support targets are shown by the green arrows, the first being an area of previous support and previous resistance at $37.50 - $38. The second is another previous area of resistance around $35.75, and the third around $34, which is the measured downside of the pennant pattern. |
| In summary, the short-term implications warrant a sell bias if 50-EMA support is jeopardized. A bounce here is not ruled out so waiting for the outcome may be the prudent plan. |
Independent Canadian equities trader and technical analyst based in Peterborough
Ontario, Canada.
| Website: | www.whatsonsale.ca/financial.html |
| E-mail address: | gwg7@sympatico.ca |
Click here for more information about our publications!
PRINT THIS ARTICLE

Request Information From Our Sponsors
- StockCharts.com, Inc.
- Candle Patterns
- Candlestick Charting Explained
- Intermarket Technical Analysis
- John Murphy on Chart Analysis
- John Murphy's Chart Pattern Recognition
- John Murphy's Market Message
- MurphyExplainsMarketAnalysis-Intermarket Analysis
- MurphyExplainsMarketAnalysis-Visual Analysis
- StockCharts.com
- Technical Analysis of the Financial Markets
- The Visual Investor
- VectorVest, Inc.
- Executive Premier Workshop
- One-Day Options Course
- OptionsPro
- Retirement Income Workshop
- Sure-Fire Trading Systems (VectorVest, Inc.)
- Trading as a Business Workshop
- VectorVest 7 EOD
- VectorVest 7 RealTime/IntraDay
- VectorVest AutoTester
- VectorVest Educational Services
- VectorVest OnLine
- VectorVest Options Analyzer
- VectorVest ProGraphics v6.0
- VectorVest ProTrader 7
- VectorVest RealTime Derby Tool
- VectorVest Simulator
- VectorVest Variator
- VectorVest Watchdog
