HOT TOPICS LIST
- MACD
- Fibonacci
- RSI
- Gann
- ADXR
- Stochastics
- Volume
- Triangles
- Futures
- Cycles
- Volatility
- ZIGZAG
- MESA
- Retracement
- Aroon
INDICATORS LIST
LIST OF TOPICS
PRINT THIS ARTICLE
by David Penn
As the homebuilders' index breaks out on the upside, are yields on ten-year notes headed lower?
Position: N/A
David Penn
Technical Writer for Technical Analysis of STOCKS & COMMODITIES magazine, Working-Money.com, and Traders.com Advantage.
PRINT THIS ARTICLE
The Triangle In Ten-Year Yields
03/08/04 12:06:01 PMby David Penn
As the homebuilders' index breaks out on the upside, are yields on ten-year notes headed lower?
Position: N/A
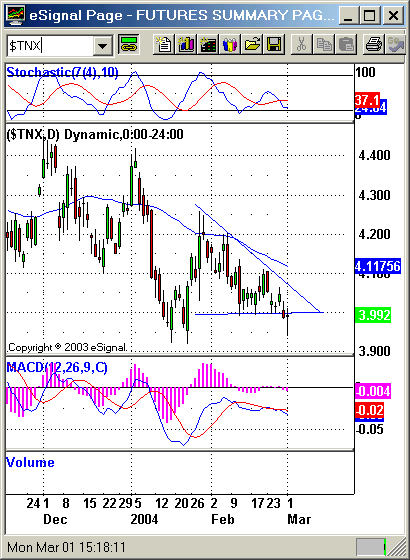
| As the chart suggests, I wrote this article on March 1st. In the time since, the $TNX has broken down from the triangle I mention. Nevertheless, because the purpose of Traders.com Advantage is to educate rather than provide stock "tips," I thought it would be worthwhile to post this article anyway, even if many readers would have preferred to have come across it days ago--before the massive breakdown in ten-year Treasury yields. *** I don't know whether it was seeing the homebuilder's index ($HGX) breakout strongly to the upside, or a recent reading of an article about mortgage innovations -- like "pay option ARMs" that increase the "affordability" of new homes through a process of negative amortization that, as the author of the article suggests, "means" that you owe more on the mortgage every month rather than less -- even if monthly payments are initially lower, but I found myself revisiting a Traders.com Advantage article I wrote about a month ago on the possibility of significantly higher, long-term ten-year interest rates ("Treasury Yields and MACD Histogram Peaks," January 6, 2004). |
| At the time, considering a weekly chart of the $TNX, I believed that the spike upward in the MACD histogram, a spike that was higher than any MACD histogram level in many, many months, meant that $TNX was headed higher. Seeing this on a weekly list does not preclude the possibility of short-term weakness that might result in lower ten-year yields in the immediate term. At the time, I was looking to see whether or not the $TNX would make a move on the August highs just north of 4.5%. What happened instead was that $TNX went on an extended sideways consolidation that, to date, has lasted from August 2003 to the present day. |

|
| A breakdown from this triangle could send the $TNX back to levels not seen since July 2003. |
| Graphic provided by: eSignal. |
| |
| It is this consolidation from which $TNX may be nearing escape. With few technical clues -- particularly as market volatility since the beginning of the year appears to have tapered off somewhat -- I am drawn both to the test of support at the 3.915 level as well as the descending triangle that appears to be forming in the $TNX price action since the beginning of the year. This triangle, if it proves to be a valid chart pattern, could represent the beginning of a drop to the 3.58 area. This area, by the way, would provide some support for a falling $TNX based on the trough formed by the correction in the first half of July 2003 (correction low: 3.617). |
| It is worth pointing out that $TNX has been a tricky trade in many ways. The methodology I've been following (a combination of Elder's use of the MACD histogram and Bradford Raschke's ANTI oscillator set-up) would not have provided for many good trades in the largely sideways $TNX since the year began (better opportunities existed earlier in the consolidation, i.e., September, October and November.) As a number of traders have pointed out, when you start seeing more winning long set-ups and your short-set-ups begin to fail you, then there is a chance that the market in general is moving higher (and vice versa). That said, the fact that neither the short nor the long signals that I look for have been particularly promising in the $TNX in recent months suggests that $TNX may be deep into its trendless consolidation pattern and that more directional movement could follow. |
Technical Writer for Technical Analysis of STOCKS & COMMODITIES magazine, Working-Money.com, and Traders.com Advantage.
| Title: | Technical Writer |
| Company: | Technical Analysis, Inc. |
| Address: | 4757 California Avenue SW |
| Seattle, WA 98116 | |
| Phone # for sales: | 206 938 0570 |
| Fax: | 206 938 1307 |
| Website: | www.Traders.com |
| E-mail address: | DPenn@traders.com |
Traders' Resource Links | |
| Charting the Stock Market: The Wyckoff Method -- Books | |
| Working-Money.com -- Online Trading Services | |
| Traders.com Advantage -- Online Trading Services | |
| Technical Analysis of Stocks & Commodities -- Publications and Newsletters | |
| Working Money, at Working-Money.com -- Publications and Newsletters | |
| Traders.com Advantage -- Publications and Newsletters | |
| Professional Traders Starter Kit -- Software | |
Click here for more information about our publications!
Comments
Date: 03/09/04Rank: 4Comment:
Date: 03/09/04Rank: 3Comment:

Request Information From Our Sponsors
- StockCharts.com, Inc.
- Candle Patterns
- Candlestick Charting Explained
- Intermarket Technical Analysis
- John Murphy on Chart Analysis
- John Murphy's Chart Pattern Recognition
- John Murphy's Market Message
- MurphyExplainsMarketAnalysis-Intermarket Analysis
- MurphyExplainsMarketAnalysis-Visual Analysis
- StockCharts.com
- Technical Analysis of the Financial Markets
- The Visual Investor
- VectorVest, Inc.
- Executive Premier Workshop
- One-Day Options Course
- OptionsPro
- Retirement Income Workshop
- Sure-Fire Trading Systems (VectorVest, Inc.)
- Trading as a Business Workshop
- VectorVest 7 EOD
- VectorVest 7 RealTime/IntraDay
- VectorVest AutoTester
- VectorVest Educational Services
- VectorVest OnLine
- VectorVest Options Analyzer
- VectorVest ProGraphics v6.0
- VectorVest ProTrader 7
- VectorVest RealTime Derby Tool
- VectorVest Simulator
- VectorVest Variator
- VectorVest Watchdog
