HOT TOPICS LIST
- MACD
- Fibonacci
- RSI
- Gann
- ADXR
- Stochastics
- Volume
- Triangles
- Futures
- Cycles
- Volatility
- ZIGZAG
- MESA
- Retracement
- Aroon
INDICATORS LIST
LIST OF TOPICS
PRINT THIS ARTICLE
by Gary Grosschadl
Has this high tech favorite topped out or is it reloading for another run?
Position: Hold
Gary Grosschadl
Independent Canadian equities trader and technical analyst based in Peterborough
Ontario, Canada.
PRINT THIS ARTICLE
CHART ANALYSIS
Siebel Systems Inc. Shows Trend Change
03/09/04 09:06:35 AMby Gary Grosschadl
Has this high tech favorite topped out or is it reloading for another run?
Position: Hold
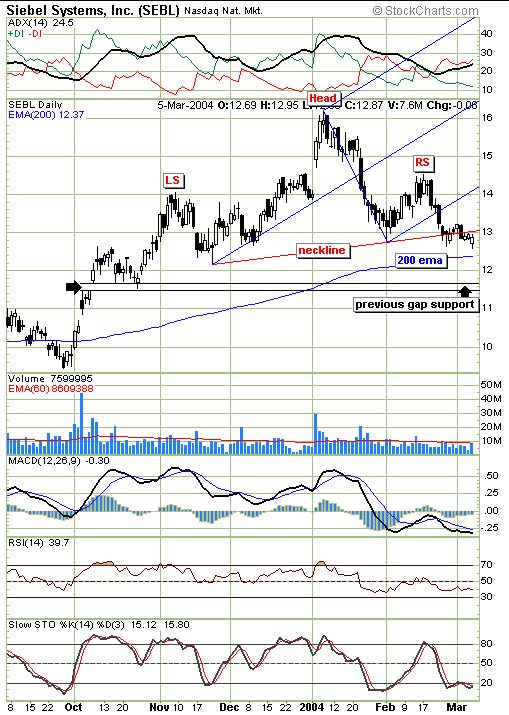
| The chart below shows some bearish developments pointing to a trend change in this daily time frame. This chart also reveals several downside and upside tests are likely to occur. |
| Siebel System's (SEBL) first sign of possible trend change was the lower high that was set at the $14.50 mark. The next hint came when the stock broke below the blue pitchfork's lower median line. The third concern is a possible head and shoulder topping pattern forming while the stock is struggling with a neckline test. However the volume pattern is not convincing. In a classic head and shoulders pattern there should be an expansion in volume, both during the decline from the right shoulder and as the neckline is broken. |

|
| SEBL's daily chart shows several upside and downside marks that could soon come into play. |
| Graphic provided by: Stockcharts.com. |
| |
| What may be helping the stock is the proximity of the often powerful support of the 200-day exponential moving average. If SEBL cannot close above the neckline soon then this 200-day EMA could be tested. Failure at that line could bring a volume spike leading to the next suggested downside support test at a previous gap as shown on the chart. |
| The upside possibility would be for a bold move above the neckline to occur, then the lower pitchfork line would become a likely test of overhead resistance. This upper mark above $14 is likely a trading target for some short-term traders. Failure there brings downside consequences that could result in another test of that neckline. A strong move back inside the pitchfork would indicate a resumption of the uptrend as far as that bullish pointing pitchfork is concerned. |
| In summary, the stock could move either way with its present location being roughly centered between two areas of upside resistance tests and two areas of downside support tests. It should be noted that the displayed indicators are looking bearish at the moment, giving a bearish bias to this current picture. |
Independent Canadian equities trader and technical analyst based in Peterborough
Ontario, Canada.
| Website: | www.whatsonsale.ca/financial.html |
| E-mail address: | gwg7@sympatico.ca |
Click here for more information about our publications!
PRINT THIS ARTICLE

Request Information From Our Sponsors
- StockCharts.com, Inc.
- Candle Patterns
- Candlestick Charting Explained
- Intermarket Technical Analysis
- John Murphy on Chart Analysis
- John Murphy's Chart Pattern Recognition
- John Murphy's Market Message
- MurphyExplainsMarketAnalysis-Intermarket Analysis
- MurphyExplainsMarketAnalysis-Visual Analysis
- StockCharts.com
- Technical Analysis of the Financial Markets
- The Visual Investor
- VectorVest, Inc.
- Executive Premier Workshop
- One-Day Options Course
- OptionsPro
- Retirement Income Workshop
- Sure-Fire Trading Systems (VectorVest, Inc.)
- Trading as a Business Workshop
- VectorVest 7 EOD
- VectorVest 7 RealTime/IntraDay
- VectorVest AutoTester
- VectorVest Educational Services
- VectorVest OnLine
- VectorVest Options Analyzer
- VectorVest ProGraphics v6.0
- VectorVest ProTrader 7
- VectorVest RealTime Derby Tool
- VectorVest Simulator
- VectorVest Variator
- VectorVest Watchdog
