HOT TOPICS LIST
- MACD
- Fibonacci
- RSI
- Gann
- ADXR
- Stochastics
- Volume
- Triangles
- Futures
- Cycles
- Volatility
- ZIGZAG
- MESA
- Retracement
- Aroon
INDICATORS LIST
LIST OF TOPICS
PRINT THIS ARTICLE
by Kevin Hopson
Evergreen's bullish consolidation pattern and pessimistic market sentiment could indicate a further move to the upside.
Position: Accumulate
Kevin Hopson
Kevin has been a technical analyst for roughly 10 years now. Previously, Kevin owned his own business and acted as a registered investment advisor, specializing in energy. He was also a freelance oil analyst for Orient Trading Co., a commodity futures trading firm in Japan. Kevin is currently a freelance writer.
PRINT THIS ARTICLE
TRIANGLES
Evergreen Resources' Bullish Triangle Formation
03/09/04 09:01:17 AMby Kevin Hopson
Evergreen's bullish consolidation pattern and pessimistic market sentiment could indicate a further move to the upside.
Position: Accumulate
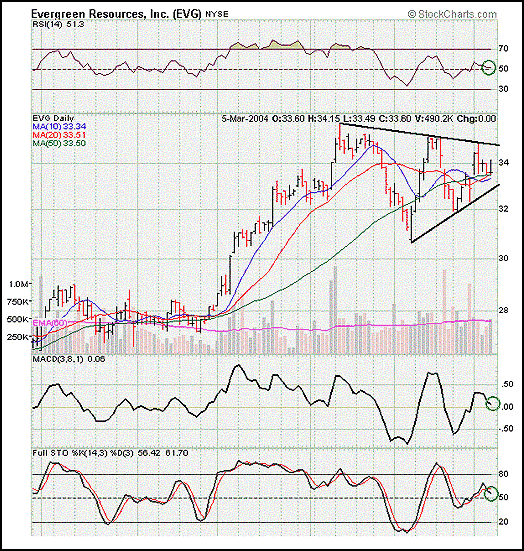
| Evergeen Resources (EVG) has been in a bullish consolidation pattern since topping out early this year. More specifically, Evergeen has seen a pattern of lower highs and higher lows, commonly known as a symmetrical triangle formation. Though the triangle is not perfectly symmetrical, it is indicative of a continuation pattern. Since the long-term trend is up, an eventual break to the upside would be expected. |
| From a market sentiment point of view, investors continue to be bearish on the stock. Short interest (as of Feb. 9) was roughly 3.88M shares, or 8.69x normal daily volume. Additionally, Evergreen's put/call open interest ratio has increased to 2.11 from 1.57 in late January. This means that investors have been buying more puts than calls during the stock's recent rise, which is usually a sign that the rally has further to go. |

|
| Graphic provided by: Stockcharts.com. |
| |
| If so, buying at current levels could prove advantageous because the stock's 10-day, 20-day and 50-day moving averages (which have all turned up) are now converging in the $33.30 to $33.50 range. Additionally, some of the major indicators - relative strength index, moving average convergence/divergence and full stochastics - are approaching potential bouncing points, as illustrated by the green circles. |
| Even if the stock pulls back to the bottom of the triangle (or black uptrend line), the risk/reward ratio (0.5) is favorable at current prices. And resistance is seen around the $34.80 level, while support is seen around the $33.00 level. Since the stock closed at $33.60 on Friday, the upside/reward ($34.80 - $33.60 = $1.20) is twice the downside/risk ($33.60 - $33.00 = $0.60) at this point. Given the favorable risk/reward ratio, bullish chart formation and potential buying pressure associated with current market sentiment, I would look to accumulate shares of Evergreen Resources in the near-term. |
Kevin has been a technical analyst for roughly 10 years now. Previously, Kevin owned his own business and acted as a registered investment advisor, specializing in energy. He was also a freelance oil analyst for Orient Trading Co., a commodity futures trading firm in Japan. Kevin is currently a freelance writer.
| Glen Allen, VA | |
| E-mail address: | hopson_1@yahoo.com |
Click here for more information about our publications!
Comments
Date: 03/16/04Rank: 5Comment:
Date: 03/27/04Rank: 5Comment: When you see a symetric triangle and what looks like a symetric triangle within the original one, that doesn t quite reach the bands of the original one. Do you find any significants in this pattern or do you just let it run its course without any other signals of direction? Intraday chart on 3/26/04 of SMH did this? Does this pattern say anything different than a normal symetric triangle in your past observations? THANKS, Earl

Request Information From Our Sponsors
- VectorVest, Inc.
- Executive Premier Workshop
- One-Day Options Course
- OptionsPro
- Retirement Income Workshop
- Sure-Fire Trading Systems (VectorVest, Inc.)
- Trading as a Business Workshop
- VectorVest 7 EOD
- VectorVest 7 RealTime/IntraDay
- VectorVest AutoTester
- VectorVest Educational Services
- VectorVest OnLine
- VectorVest Options Analyzer
- VectorVest ProGraphics v6.0
- VectorVest ProTrader 7
- VectorVest RealTime Derby Tool
- VectorVest Simulator
- VectorVest Variator
- VectorVest Watchdog
- StockCharts.com, Inc.
- Candle Patterns
- Candlestick Charting Explained
- Intermarket Technical Analysis
- John Murphy on Chart Analysis
- John Murphy's Chart Pattern Recognition
- John Murphy's Market Message
- MurphyExplainsMarketAnalysis-Intermarket Analysis
- MurphyExplainsMarketAnalysis-Visual Analysis
- StockCharts.com
- Technical Analysis of the Financial Markets
- The Visual Investor
